Developing the Solution
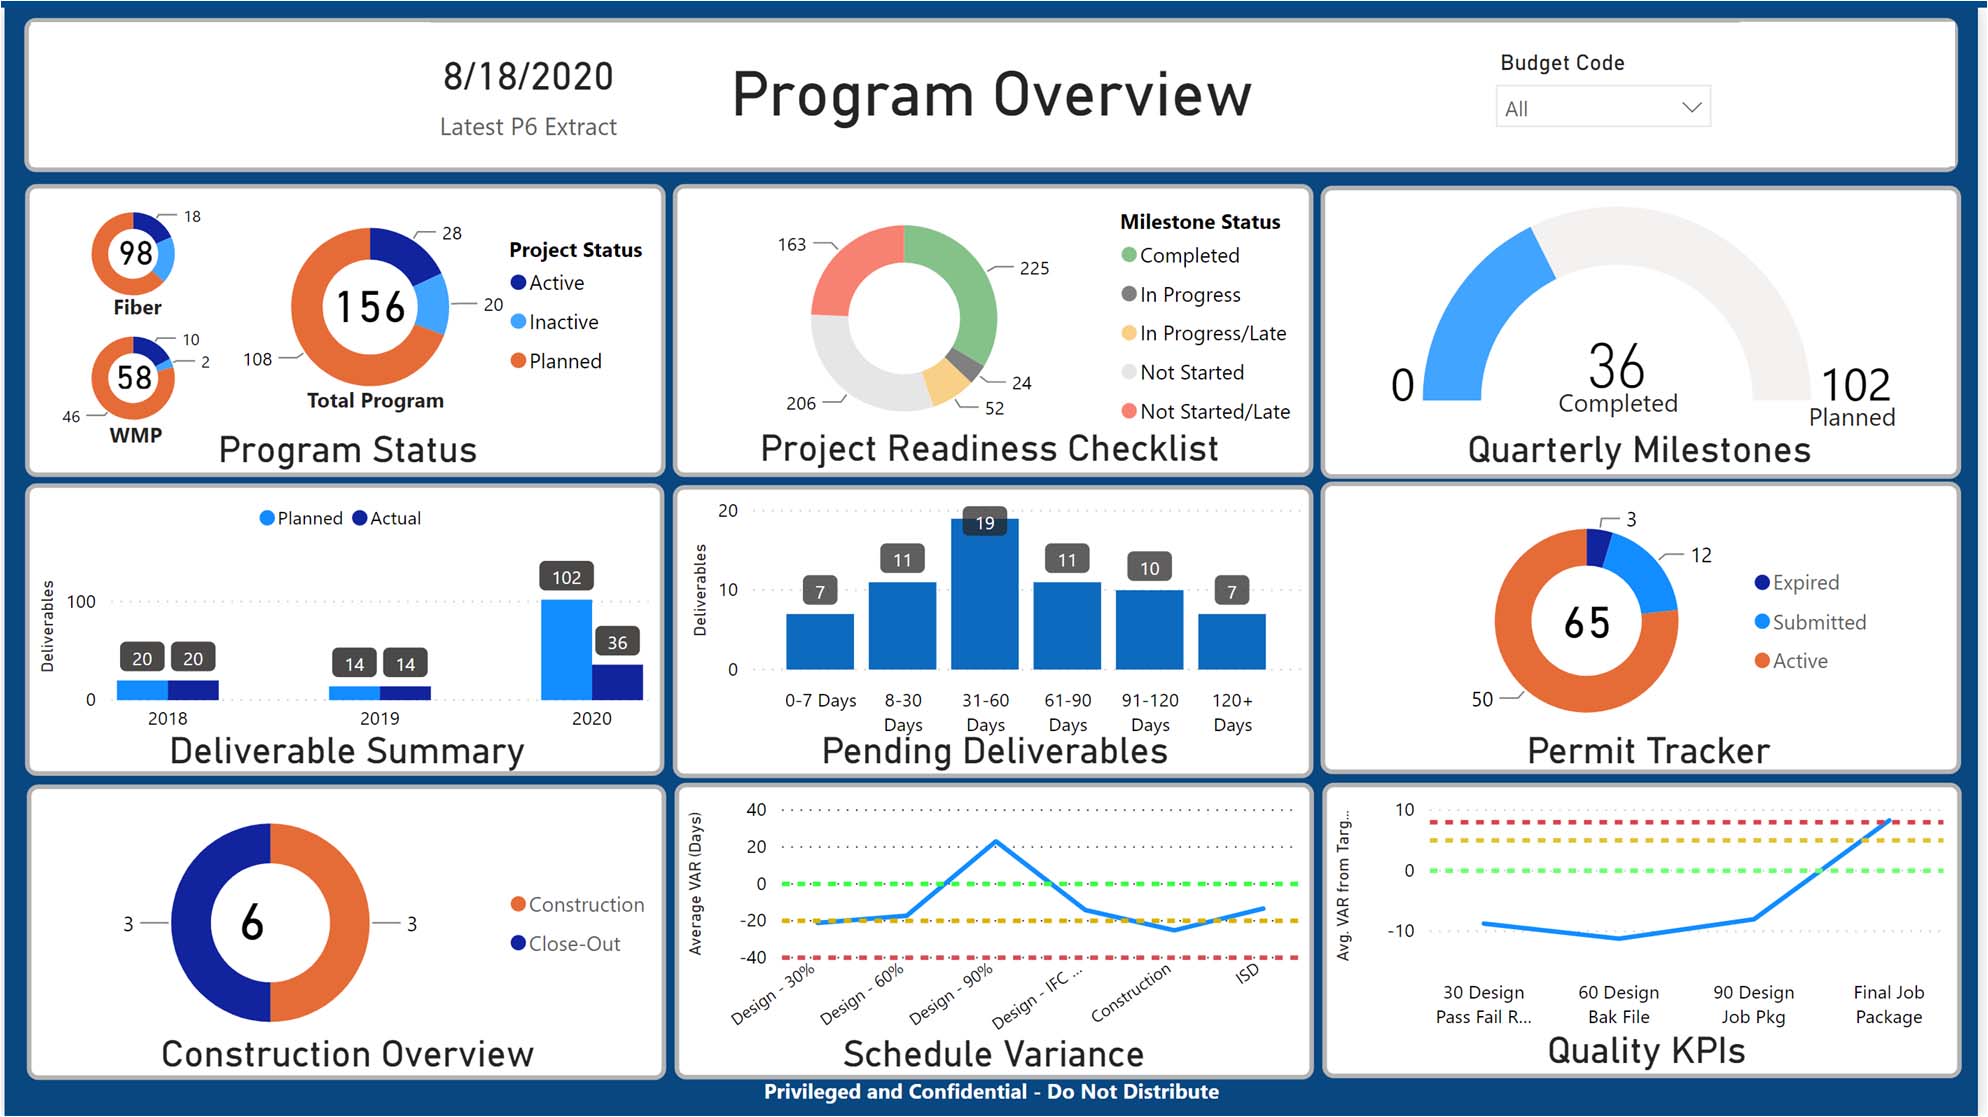
The integrated team began developing a digital dashboard solution that would automatically consolidate and aggregate the project data from multiple sources into a single repository. This would eliminate many laborious and often manual data stewardship tasks.
This effort started with documenting data sources and reporting needs. This was essential in order to map what data is needed as inputs and what the outputs would look like. The 1898 & Co. team evaluated multiple data sources including ERP-type applications (Primavera P6), the document management system (Aconex), and Excel spreadsheets. Then they developed a plan to drive to dashboard visualization.
Multiple dashboards were needed for the project, but the process to develop a dashboard generally followed this path:
- Determine the data source and review existing data.
- Model the data and create the corresponding data architecture so that the appropriate relationships can be established between the data sources.
- Cleanse the data so it can be normalized into a database (much of the data in spreadsheets do not follow good standards and need some cleaning before it can be fully utilized).
- Create an automated process to periodically grab the data source.
- Ingest the data into a structured database.
- Build dashboards to visualize the data.
- Review dashboards with stakeholders and modify as necessary.
- Publish the dashboards for all users.
Several tools were utilized for this program, including:
- Oracle P6 for project management and scheduling.
- IBM’s TM1 for forecasting.
- SAP Financials for managing project costs.
- Aconex for business process workflows and document management.
- Custom spreadsheet trackers to report on key activities such as permitting and construction scoping.
Implementing these steps took about eight weeks from start to utilization and required close engagement between the dashboard team and the program management team to be certain project needs were met and the data analytics were meaningful.
The overall solution was developed utilizing tools such as Safe Software’s Feature Manipulation Engine (FME) for Extract/Transform/Load processes, Microsoft’s SQL Server on Azure for data storage, and Microsoft’s PowerBI for reporting and visualization.