To support the increase of photovoltaic (PV) power plant projects expected to have a 35-year or more life span, we have conducted a systematic analysis for predicting long-term performance degradation of PV power plants. Our research compiles a refreshed literature survey and analyzes data on PV power plants that have been in operations for five years or more.
To support the increase of photovoltaic (PV) power plant projects expected to have a 35-year or more life span, we have conducted a systematic analysis for predicting long-term performance degradation of PV power plants. Our research compiles a refreshed literature survey and analyzes data on PV power plants that have been in operations for five years or more.
Background
In 2010, our team developed a PV module test rig to monitor degradation of products several original equipment manufacturers (OEM) were introducing to the market. In 2011, we completed a survey of resources on the subject of performance degradation of PV systems (e.g., modules, inverters, transformers, etc.) with a specific focus on long-term performance of 25 years or more.
Our initial survey of articles about module power degradation pointed out the difficulty and complexity of predicting module performance over a long period of time, especially up to 25 years and beyond. However, with time, more understanding has been obtained and greater amounts of field data are available. For example, we have supported the development of more than 4 gigawatts of solar PV facilities since 2008, providing field degradation data that was not available when we published our initial survey of resources.
Long-term performance throughout the life of a PV plant was and remains an area of focus. Accurate prediction of performance degradation is especially important to determine risks and investment value. With project investors now considering the finances of PV power plants with a 35-year life span or more, accuracy of long-term performance degradations becomes even more vital.
PV module degradation testing and measurement
Causes of PV module power degradation
A 2014 International Energy Agency (IEA) studyi identified the main modes of PV module power degradation and the approximate timeline for each (Figure 1). The IEA data demonstrate how PV module power degradation is often a function of manufacturing quality and environmental conditions. Inconsistencies in manufacturing can produce variabilities in field performance. For early PV power projects, bad lots of modules came off the production line with flaws undetectable until after installation, resulting in unexpected performance. In 2010, one of the top-tier solar module manufacturers had to replace a large volume of modules due to a manufacturing “excursion” resulting in premature power loss.
Testing methods for module power degradation
There are two primary methods in use today for testing PV module power degradation: accelerated testing, and long-term site testing.
The International Electrotechnical Commission (IEC) developed a series of rigorous testing requirements for the qualification of solar modules in the mid-1990s. Module manufacturers failed a large percentage of these tests until 2010, when an influx of manufacturers entered the booming market. Accelerated tests are useful for demonstrating the reliability and durability of solar modules. However, these tests cannot simulate every field condition. So, while OEMs today may consistently report expected degradation rates that are significantly less than guaranteed values, these projections are largely based on extended environmental tests beyond IEC standards.
Test organizations, such as the National Renewable Energy Laboratory (NREL) and Sandia National Laboratory, express caution about overly optimistic views of OEM degradation data due to high variability in environmental conditions. For example, modules located at a site that has environmental extremes, such as wind, heat and humidity, are expected to have more degradation than a site that has fewer extremes. For these reasons, long-term site testing will yield the most reliable results.
FIGURE 1: IEA PV Module Power Degradation Timeline. Source: IEA
The lengthiest long-term field tests have been ongoing for nearly 30 years. However, the technology has advanced at a rapid pace over the past decade. As a result, the oldest test sites are using technology that, in many instances, is dramatically different than modern technology.
For long-term field tests, each test site presents a different set of conditions that is not applicable to every site and technology. For example, a module may not yield the same life span in Florida as it would in Arizona due to differences in humidity levels, as demonstrated by a 2016 study in India that found that modules in hot and humid environments degrade faster than those in cold climatesii.
With solar cells specifically, degradation rates appear to be proportional to the PV activity of each because heat and light can affect the impurities within the cell. The best-known phenomenon is initial light induced degradation (LID). A lesser-known and less-understood phenomenon is carrier induced degradation (CID), which can be accelerated by heat within poly-Si cells. Anything that impacts the generation of electron-hole pairs (e.g., the yellowing of the cell’s potting material) or increases the recombination of electron-hole pairs (e.g., changes in the cell that reduce minority carrier lifetime) will lead to cell degradation. For most silicon cells, the minority carriers are electrons “looking” for a quick way to get to the metallization on the front of the cell and go around the electrical circuit to the back of the cell. If they do not “find” a path quickly enough, they recombine with a hole producing only heat rather than electric currentiii.
Degradation measurement methods
In recent years, there has been a concerted effort across the industry to uniformly standardize methods for measuring PV module power degradation. NREL, specifically, has provided in-depth reports and studies on degradation measurement methods. In 2016, NREL published a report on numerous studies it had conducted that compared various measurement methods using the “year-on-year” approachiv. Measurement methods included performance ratio under clear skies (PRcs), performance ratio under practical test conditions (PRptc), and other, more conventional, approaches such as conducting I-V measurements and IR scans, among others. Findings were then summarized in a quarterly report (Qr). Figure 2 provides a comparison of PRcs and PRptc results and findings within the Qr. Notably, some of the studies showed small, negative degradation rates, which may reflect measurement uncertainties or a lack of accurate baseline data.
FIGURE 2: NREL comparison of measurement methods
A more recent and comprehensive NREL-related study, published in the IEEE Journal in 2017, summarized all of the methods used and provided comments on the validity of eachv . The authors of the study proposed a methodology for determining PV degradation using available modeled clear-sky irradiance data, rather than site sensor data, and a year-over-year rate calculation, stating that this methodology would provide reliable estimates with the least amount of uncertainty.
Predicting performance
A consensus that emerged in the review of various reference materials was the need for more field data and analytical tools that could better predict system performance.
Sandia National Laboratories developed an analytical tool, Photovoltaic Reliability and Performance Model (PV-RPM), to evaluate various PV technologies within various operational scenarios and environmental conditions. This tool “improves the techno-economic analysis by calculating the effects of component faults and failures on the overall systems’ Levelized Cost of Energy (LCOE) with confidence intervals included as a result of applying a probabilistic frameworkvi.” NREL has also developed a software tool, RdTools, that uses various measurement methods to more accurately calculate module degradation rates from modeled and site data. This tool, which is still in prototype form, is publicly available for use and testing. As a result of the efforts by Sandia, NREL and other organizations, we expect the industry to reach agreement on a standardized method for measuring PV module power degradation within the next five years.
Currently accepted degradation rates
The following sections provide an overview of current degradation rates used within the industry and the basis for the use of a specific degradation rate for listed technologies.
Crystalline silicon
Today, most projections employed in financial analysis use a degradation rate of 0.7 to 0.8 percent per year, depending on the factors mentioned. Most studies confirm this is a good range, with higher quality modules yielding 0.7 percent as an average. Median values are typically lower since mean values are often skewed by outliers.
In the previously referenced study, NREL used the year-over-year Performance Ratio under Clear Skies method to study a subset of SunPower’s existing plants. This study represented one of the largest data sets analyzed in literature, with a mean age of the plants at 7.3 years. The analysis showed considerably better degradation values for interdigitated back contact (IBC) modules than conventional methods as illustrated in Figure 3.
FIGURE 3: NREL degradation study of silicon crystalline technology. If these findings are accurate, it would suggest that IBC type technology outperforms all other silicon crystaline technology in terms of reduced degradation. Source: NREL
Thin film
In early studies, annual degradation rates for older thin film modules — manufactured before 2006 — were consistently greater than 1 percentvii. However, degradation rates in newer technologies — long-term data available, the uncertainty of these rates is greater and degradation rates of thin film modules are still under investigation.
Data indicate slightly worse degradation rates for less proven non-cadmium telluride (CdTe) thin film technologies than for crystalline silicon. For example, copper indium gallium selenide (CIGS) modules show higher losses than expected — 3 to 4 percent per year — in high-voltage test arrays. CIGS module annual degradation at lower voltages was between 1 percent and 2 percent. Most of the losses are attributed to increases in series resistance due to degradation of the ZnO Transparent Oxide Conductor layer, and the interfaces between the CdS window layer and CIGS absorberviii. The Jordan et al NREL study showed a mean CIGS annual degradation rate of 1.44 percent prior to the year 2000, and 0.96 percent after 2000vii.
Non-CdTe thin film module technologies have not gained much market share in utility-scale solar. When it comes to thin film, the main technology of concern is the First Solar CdTe module, which has approximately 4 percent of the global market share. First Solar has done significant testing and data analysis over the last eight years and now has more confidence in its degradation rate to the point where it is guaranteeing a 0.5 percent rate instead of a 0.7 percent rate, as illustrated in Figure 4ix. However, independent studies still show annual degradation rates for CdTe modules at approximately 1 percentx.
Inverters
Inverters are the solar plant components under the most stress and, therefore, the weakest link in terms of reliability of the PV system. Based on our experience, inverters account for more unscheduled maintenance events than any other component. Consequently, inverter long-term durability and operations and maintenance (O&M) costs should be considered in any system evaluation. Sandia National Laboratories is currently investigating inverter degradation ratesxi.
Since the inverter is mostly electronic (the IGBT is a semiconductor transistor), it is not expected to experience significant degradation. That is, its efficiency of converting direct current (DC) power to alternating current (AC) power should remain nearly the same throughout its lifetime. The system will experience power loss though the degradation of the PV modules. One of the most significant potential losses would come from voltage loss. As the DC system (the modules and strings that feed the inverter) ages, it will lose power, which can be reflected in voltage loss. If the inverter maximum power point tracking (MPPT) window is not wide enough, or if the system was not designed to be in the higher edge of the voltage range, the PV system could experience severe power loss as the modules degrade to the point of operating outside of the window for much of the yearxii. We estimate that under-voltage losses could be as large as 10 percent by year 10, and 25 percent by year 25 for some plants.
FIGURE 4: First Solar non-CdTe thin film degradation rate.
Direct current (DC) system
Other system parts that can fail or degrade during the course of the plant life are electrical connections (e.g., multi-contact connectors, disconnects) and components (relays, fuses) exposed to harsh environments that see frequent and extreme thermal cycles and winds, dust and humidity, as well as transformers that can degrade if not regularly maintained.
While system performance is affected by degrading PV modules, not all modules will necessarily degrade at the same rate. For example, a string can greatly underperform if one of the modules has lost more of its power output capability relative to the others, resulting in increased module mismatch. PVsyst recently added a utility to model this but recognizes that the input assumptions are highly uncertain.
Correspondingly, one of the key system factors affecting long-term performance that was highlighted in literature was O&M and monitoring capabilities. One example of a poor-performing project was a plant in California that lost more than 50 percent of its capacity within six years primarily as a result of poor O&Mxiii. From 2012 to 2019, we have worked with clients to troubleshoot and improve over 10 poor-performing plants. The causes for poor performance among these plants have ranged from blown fuses to inverter thermal issues to SCADA system malfunctions or inadequacies, all of which can be mitigated through strong O&M programs.
Balance of system
Once implemented on-site, PV modules and system components become part of the larger, interconnected grid system that can introduce unplanned interactive stresses and additional degradation factors. PV module degradation specifically can be partially offset by overbuilding the DC capability of the plant or creating high DC-to-AC ratios. High DC-to-AC ratios typically result in inverter clipping during much of the year. However, as modules degrade, the degradation is partially offset by reduced clipping. A similar phenomenon can occur if the plant initially can exceed its point of interconnection (POI) limit and is curtailed to stay within that limit.
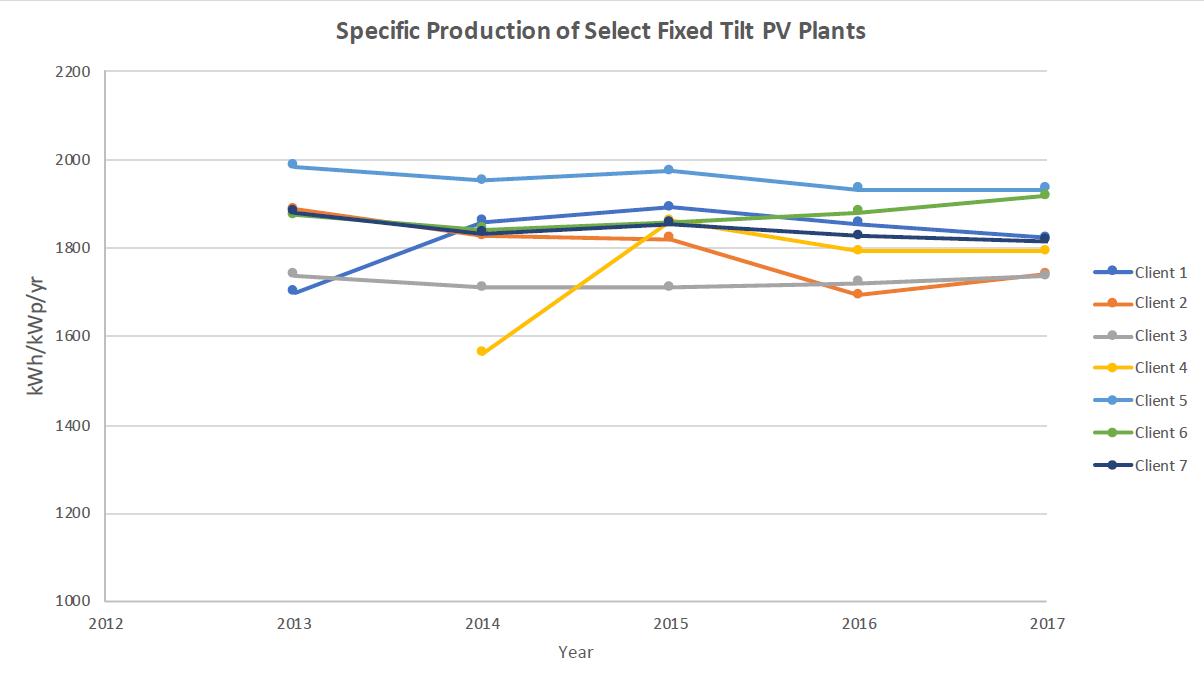
FIGURE 5: Production from Select Fixed Tilt PV Plants (Normalized by Annual GHI)
System factors that can result in additional degradation can be classified into two broad categories: equipment-related, and grid-related. Equipment-related factors include major equipment, such as inverters and transformers, availability, and what is referred to as “DC Health.” DC Health can include blown DC fuses, bad DC interconnects and tracker issues.
Grid-related factors include grid outages and, more recently, curtailment required by the utility or the grid operator. In addition, grid voltage extremes may require the PV plant to operate far enough off of unity power factor at the POI that inverters must reduce production of real power in order to meet the reactive power requirements. To offset the impacts of grid voltage extremes, the PV design may include capacitor banks that prevent the reduction of real power.
Historical PV plant performance
We surveyed 13 utility-scale PV power plants in Arizona, California and Nevada that were put into service in 2013 or earlier. We used production data reported to the U.S. Energy Information Agency (EIA) in conjunction with publicly available information regarding plant configuration. Combined, the surveyed plants represent approximately 2 GW (AC) of generating capacity, providing strong representation of actual performance of early utility-scale PV projects in the southwest U.S.
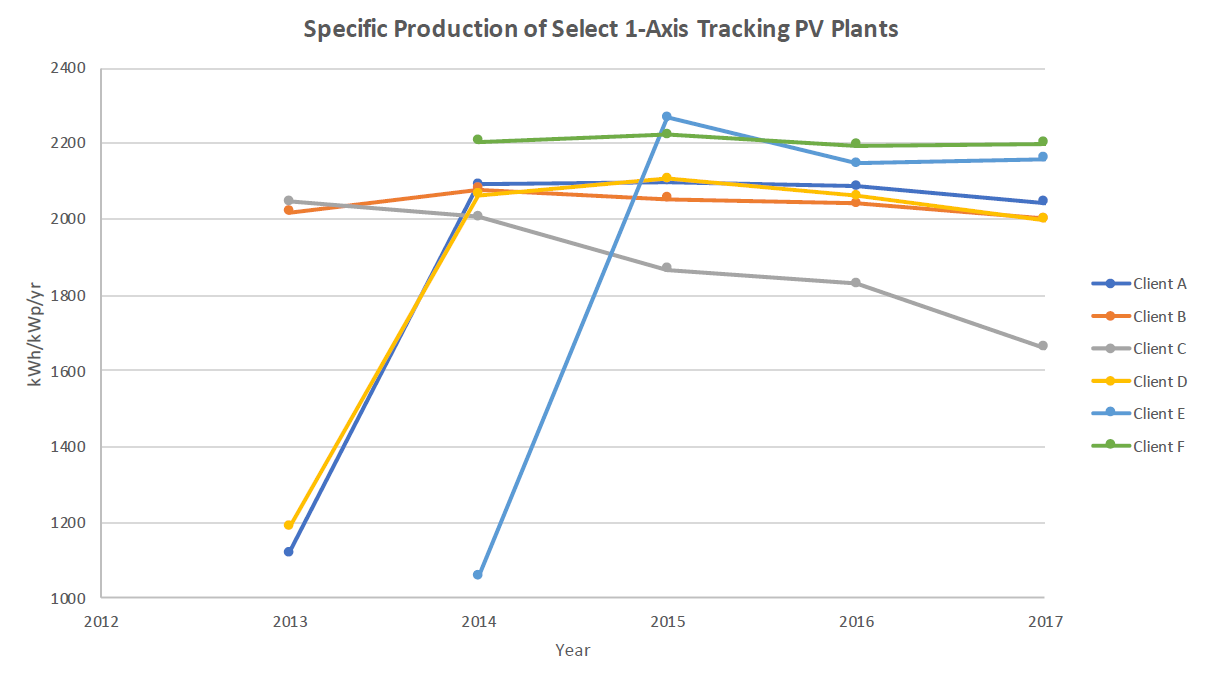
FIGURE 6: Production from Select Single-Axis Tracking PV Plants (Normalized by Annual GHI).
It is important to note that irradiance levels and soiling have a direct impact on PV power plant production. Ambient temperatures and wind speeds have a secondary effect on energy production. In the absence of reliable soiling data, only the annual irradiance estimated data provided by NREL’s National Solar Resource Database have been used to normalize annual energy production figures from these facilities. Irradiance estimated data from 2012 were used as a baseline for all sites for the purpose of normalization.
Of the 13 plants surveyed, seven employed fixed-tilt technology and six employed single-axis tracking. Of the fixed-tilt technologies, all but one utilize CdTe modules with the other utilizing poly-Si modules. Single-axis tracking projects are exclusively silicon-based, representing conventional p-type poly-crystalline silicone (on four project sites) and n-type mono-crystalline (on two project sites). Finally, the silicon modules within the power plants surveyed were manufactured by no fewer than four different companies.
Figures 5 and 6 provide production estimates for each site in absolute terms (kilowatt-hours/kilowatt peak per year) for ease of comparison with other projects, including those not in this survey. It’s important to note that significantly lower values during the first year could be due to partial capacity in use during that year.
Initial observations from this survey show that the specific production levels are generally in alignment with ranges predicted by PVSyst, and specific production levels show low rates of decline after the first full year of production for all but two of the plants. CLIENT 6 and, to a lesser degree, CLIENT 4 show marked declines in production.
It is interesting to note that the CLIENT 6 and CLIENT 5 projects were built by the same developer at generally the same time but show significantly different rates of degradation. It is not clear if both projects used the same make of PV modules, though it is a likely scenario because developers typically aggregate PV module purchases with one supplier to obtain optimal prices and terms. If both facilities use the same PV modules, then other factors involving the O&M of each facility could be the reason for higher rate of degradation at the CLIENT 6 plant. The CLIENT 6 plant’s capacity is approximately 4.5MW (AC) and is a significant distance from Tucson, Phoenix and Gila Bend, Arizona, where O&M companies are likely to maintain staff. This may have resulted in less timely corrective maintenance at the CLIENT 6 facility.
With the CLIENT 6 facility removed from the poly-Si list of projects, and using linear regression for valid years, the annual degradation of the remaining poly-Si plants is approximately 0.43 percent per year. This degradation rate is in alignment with rates reported in literature reviewed elsewhere in this paper, such as the article “Robust PV module degradation methodology and application.”
For all CdTE projects, the degradation rate is approximately 0.5 percent per year, which is also in alignment with rates reported in other studies.
The two projects utilizing n-type, mono-crystalline modules showed high rates of plant degradation at approximately 1.19 percent per year for the CLIENT 8 plant, and 2.5 percent per year for the CLIENT 9 plant. However, the data for both, particularly CLIENT 9, are limited due to ramp-up years and the small sampling size for the technology. In addition, these facilities could have been impacted by availability issues or curtailment. As a result, no definitive conclusions should be made from this data.
Looking at individual project projection trends, it is clear that overbuilding the DC capacity of a plant can be effective in reducing plant degradation rates. Certain plants also appeared to have some startup issues that resulted in an increase in production rates in the second year, followed by slow declines. In other cases, the increase in production from first year to the second year reflects portions of the plants coming online in different years.
While our plant survey was limited due to uncertainties in measurements, specifically NREL’s irradiance data and a lack of insights into availability and curtailment, the survey does provide a high level of assurance that with proper O&M utility-scale power plants can experience low — less than 1 percent per year — plant degradation in the first five years of operation. Only as more years of data become available can this methodology confirm that these trends would be expected to continue throughout the expected life of the plant. However, based on the module degradation studies and system degradation studies reviewed, that assumption appears to be reasonable.
Conclusions
Based on the literature and site surveys conducted, as well as our own independent studies, we recommend using a degradation rate of 0.7 percent per year, plus or minus 0.1 percent for CdTe Thin Film and crystalline silicon. Limited data from a sample of existing utility-scale power plants in operation in the southwest U.S. by 2013 indicate that, in most cases, plant degradation is less than 1 percent per year. Excluding obvious outliers, the estimated plant degradation rates for poly-Si modules was 0.43 percent per year and 0.50 percent per year for CdTe modules. This corresponds well with rates appearing in reviewed literature.
It is important to note that values should be adjusted according to specific application and technology and should still be considered estimates and not fully linear. For example, if a project is using a silicon module from a top-tier manufacturer in a mild and dry climate and will be maintained and operated by an industry-leading firm, a degradation rate of 0.6 percent, or even 0.5 percent, may be more appropriate. If a good O&M program and proven modules are in place, it is not unreasonable for PV plant owners to expect their plants to produce at a 0.5-to-1 percent degradation rate even beyond 25 years. Degradation rates have been shown to be fairly linear in long-term tests. LCOE predictors should be able to use a linear extrapolation beyond 25 years in their model.
Weather and environmental conditions also impact PV systems, which is why the ideal benchmark for predicting long-term performance remains field testing at or near the proposed site or area. At a minimum, since weather directly correlates to potential performance, weather stations should be set up as soon as land is procured in order to obtain one to three years of meteorological data.
Moving forward, independent power producers and utilities should access the PVRAM model by NREL to see if it can provide useful data for their own models. They may also want to consider contributing to the model to help improve its accuracy and usefulness. Furthermore, additional data on inverter degradation should be collected to refine the LCOE and other models.
Thin film technology initially had the greatest amount of uncertainty. However, many concerns with the technology have been alleviated through continued improvement and testing. First Solar, the only significant provider of thin film modules to the utility-scale market, has made significant improvements during the last decade, providing its customers with greater confidence in terms of consistent power output and lessened degradation.
Conclusions represent improved knowledge and confidence gained during the past decade regarding degradation rates. However, the industry requires an additional 10 years of research and data collection to gain full confidence in degradation rates.
REFERENCES
i. M. Kontges; S. Kuntz, C. Packard, J. Ulrike, International Energy Agency, Review of Failures of Photovoltaic Modules, IEA-PVPS T13-01-2014. March 2014.
ii. Dirk C. Jordan, Sarah Kurtz, Kaitlyn VanSant, and Jeff Newmiller, “Compendium of PV Degradation Rates,” Progress in Photovoltaics: Research and Application, February 2016.
iii. Alam, Md Mahabubul. “Carrier Induced Degradation of Multi-Crystalline Silicon Solar Cells: Electroluminescence Study.” 10.13140/ RG.2.2.27576.80641, 2018.
iv. Various presenters, NREL 2018 Proceedings on Reliability and Durability of PV ref: NREL 2016 Review Paper of 200 studies and 11k degradation rates: Prog. Photovolt: Res. Appl. 2016.
v. Jordan et al, “Robust PV module degradation methodology and application,” IEEE Journal, 2017.
vi. Peter H. Kobos, Geoffrey T. Klise, La Tonya N. Walker, Olga Lavrova, Sandia National Laboratories, Integrating Component Failures for Performance Uncertainty in Solar Photovoltaic System Cost Modeling, SAND2016-0212C. 2016.
vii. Dirk C. Jordan and Sarah R. Kurtz, Photovoltaic Degradation Rates - An Analytical Review, NREL, June, 2012.
viii. J.A. del Cueto, S. Rummel, B. Kroposki, C. Osterwald, A. Anderberg, “Stability of CIS/CIGS Modules at the Outdoor Test Facility Over Two Decades,” National Renewable Energy Laboratory (NREL), 1617 Cole Boulevard, Golden, CO 8040, 2008
ix. FirstSolar. http://www.firstsolar.com/Modules/ Our-Technology. Accessed January 21, 2019
x. Dirk C. Jordan, Sarah Kurtz, Kaitlyn VanSant, and Jeff Newmiller, “Compendium of PV Degradation Rates,” Progress in Photovoltaics: Research and Application, February 2016
xi. Jennifer E Granata, Michael A. Quintana, “Reliability of PV Systems – How Long Can We Expect Them to Last?,” SEPA Webinar, Sandia Labs, June 25, 2009.
xii. Paul Grana, “The Time Bomb of Low Voltage Plus Degradation,” Solar Power World, October 16, 2017.
xiii. A.W. Czanderna and G.J. Jorgensen, “Service Lifetime Prediction for Encapsulated Photovoltaic Cells/ Minimodules,” Center for Performance Engineering and Reliability, National Renewable Energy Laboratory, Golden, CO 80401-339, 1997