Peak energy demand is like an SEC college football stadium on a Saturday afternoon in the fall. The press box is packed, concession lines are long and virtually every seat is filled. The next day, the stadium goes quiet. But it still must be designed and equipped to meet demand on a few very busy days each year.
Electric utilities understand this type of challenge. They must maintain the capacity to produce or purchase enough power to meet customer demand and balance the load on the busiest — and often hottest — days of the year. In this case, however, peak demand can continue to rise over time, and utilities have historically had to add capacity to meet it.
This can be expensive, given that the gas plants traditionally used for this purpose are relatively expensive to operate — and then sit dormant much of the time. Energy during peak usage hours, as a result, typically is a utility’s most expensive to generate. The electricity for the 150 highest demand hours, in fact, can cost two to three times more to generate than the average load. If a utility uses a time-of-use rate schedule, that cost is passed directly to the customer.
It makes good economic sense therefore, for utilities to find ways to reduce peak demand. Lowering peak demand not only saves money and prevents overbuilding power generation but also can lead to lower electricity rates in some instances and help ward off rate increases in others. The question is: How might a utility effectively lower peak demand?
LOAD PROFILE ANALYSIS
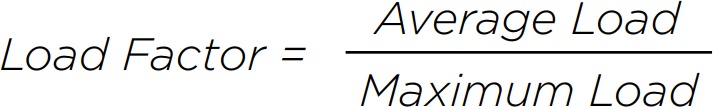
Some utilities look to renewable energy, such as solar power, as a feasible solution for reducing their “peakiness,” or load factor, which is calculated by dividing the average load by the peak (or maximum) load.
Many assume that because peak demand is often driven by high temperatures, it therefore coincides with high solar production. Our team studied a yearlong projected load profile taken for a Southern U.S. utility to test this theory.
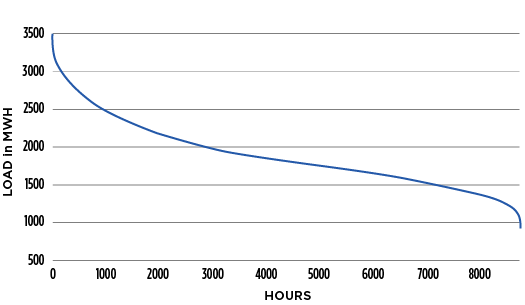
FIGURE 1: EMI Demand Curve 2019 Projection.
METHODOLOGY
For this analysis, the utility’s load profile was sorted, not chronologically, but from the hourly maximum load to the hourly minimum load over the course of one year. (Figure 1.) “Peakiness” is clearly demonstrated in the first 150 hours, which demonstrated a load factor of 0.54.
To determine how residential solar power would affect this load profile, our team used System Advisor Model (SAM) software from the National Renewable Energy Laboratory (NREL) to obtain an approximate solar insolation and production profile for the geographic area.
A system consisting of 1 GW of solar power was then simulated, taking into account various azimuthal angles — that is, the cardinal direction a solar panel faces — and optimal tilt levels. This represented an aggregate 1 GW of solar installation spread throughout the power grid.
The analysis was conducted using southern, southwestern and western orientations for the solar panels. This is because loads tend to be highest during the late afternoon and many peak production hours occur at that time. West-facing panels begin producing later in the day, but also end later. A southern orientation maximizes the total cumulative energy produced, but maximum production occurs earlier in the day.
The SAM software model exhibited some limitations. For example, it appeared to cut off solar production at 3 p.m. each day, regardless of azimuthal angle and tilt. This early cutoff could produce test results that differ from actual results, especially for panels in a west-facing scenario. Because solar production is relatively low after 3 or 4 p.m., however, this difference would not likely affect the load factor in a meaningful way.
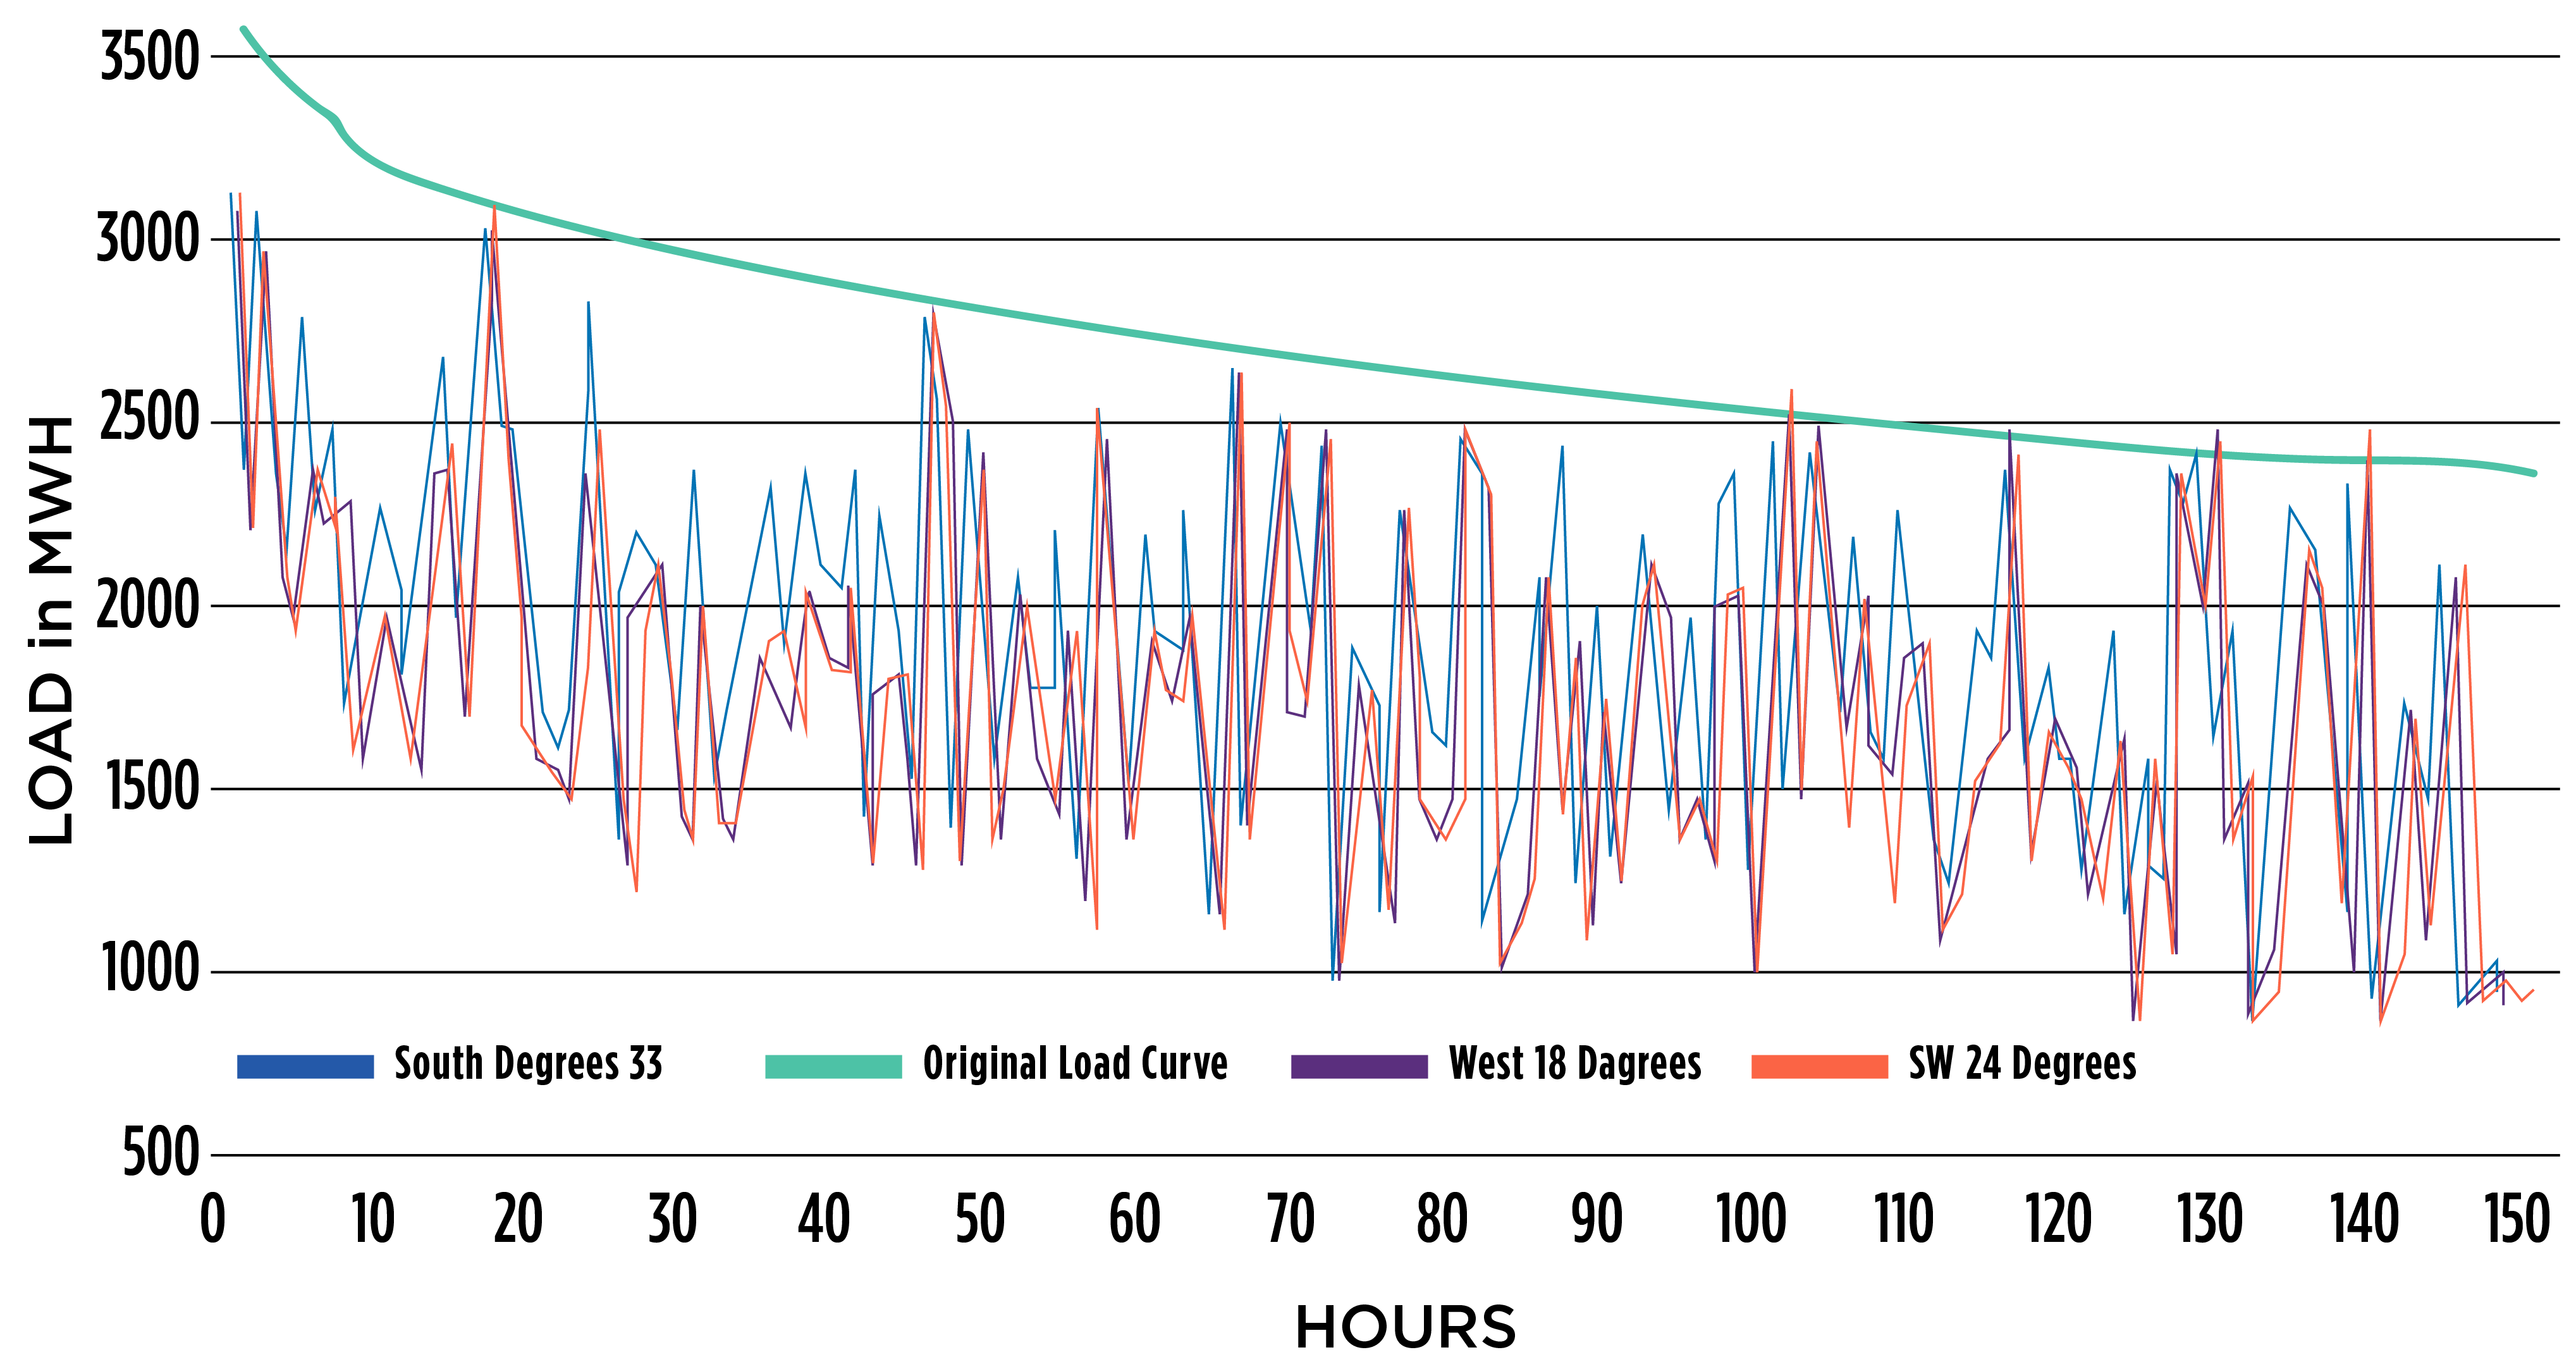
FIGURE 2: Solar Impacts on Critical Peak Hours.
FINDINGS
To calculate the impact of solar energy on load factor, our team subtracted hourly solar production from the utility’s hourly load profile. The results showed that the addition of 1 GW of solar power offset 150 MW of peak demand. These findings indicate that solar panels help to offset peak demand because they sometimes operate when demand is high.
When the same demand data includes solar production, both peak and overall demand are reduced. Even though the shape of the curve appears unchanged, the load factor decreases.

FIGURE 3: Effects of Solar on Load Factor.
CONCLUSION
While solar generation could significantly lower the utility’s overall peak demand, it also decreases load factor, on average, from 0.54 to 0.525. If increasing load factor is an objective, utilities may find other demand response initiatives to be more effective. Energy storage, demand pricing and load curtailment, for example, can be effective at targeting the 150 hours that have significantly higher costs than the rest.
In summary, reducing the top 50 to 150 hours of peak demand to match more closely with the rest of the load profile can reduce the cost of power delivery. Given the plummeting costs of solar and the added benefit of cheap generation throughout the rest of the year, renewables may not improve load factor but very well may be a viable option for mitigating peak demand.