White Paper

Novel Approach to Finding Ideal Microwave Tower Sites Utilizes Mobile Coverage Maps

Microwave network planning is being made easier with radio frequency coverage maps that reduce site evaluation time, minimize rework and accelerate design timelines.


Building a network of microwave towers involves identifying the most ideal locations for new towers to have reliable signal transmission. This process is often challenging because the towers must have a clear, unobstructed path for the signal, and the exact height of the tower and antenna must be calculated.

Such towers are essential for microwave communication that is a critical component of modern wireless networks, offering high-capacity, low-latency backbone connectivity for applications such as high-speed networking, emergency services, mobile communication and industrial automation. As a backbone solution, microwave links are used to carry large amounts of data between major network points.


Read More  

Building a network of microwave towers involves identifying the most ideal locations for new towers to have reliable signal transmission. This process is often challenging because the towers must have a clear, unobstructed path for the signal, and the exact height of the tower and antenna must be calculated.

Such towers are essential for microwave communication that is a critical component of modern wireless networks, offering high-capacity, low-latency backbone connectivity for applications such as high-speed networking, emergency services, mobile communication and industrial automation. As a backbone solution, microwave links are used to carry large amounts of data between major network points.

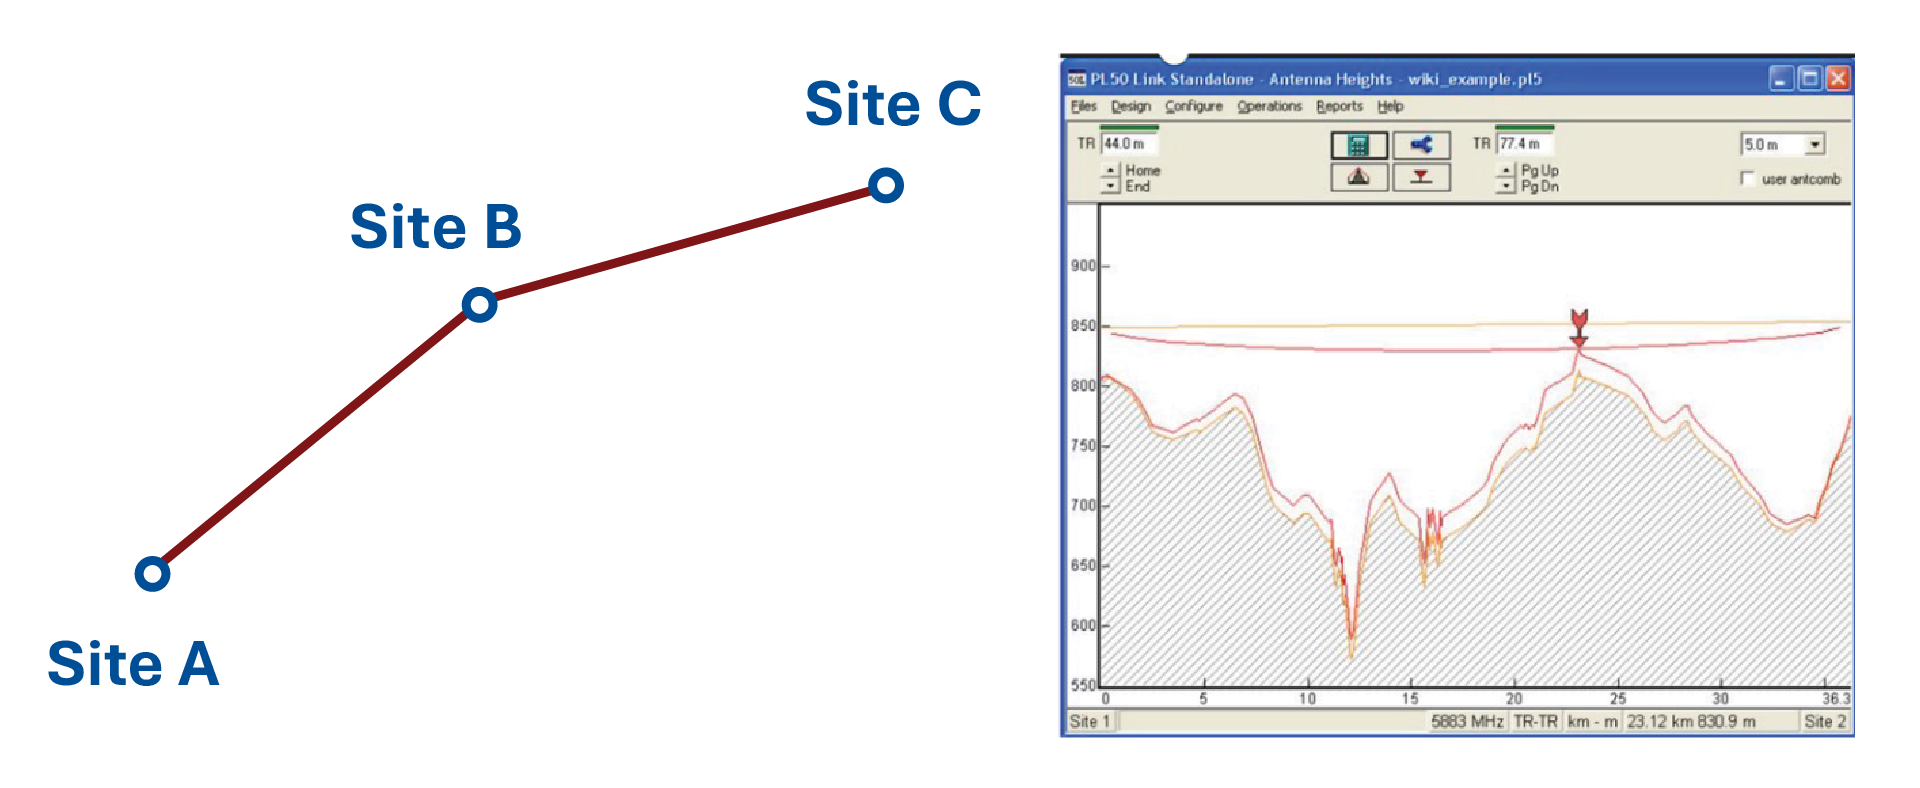
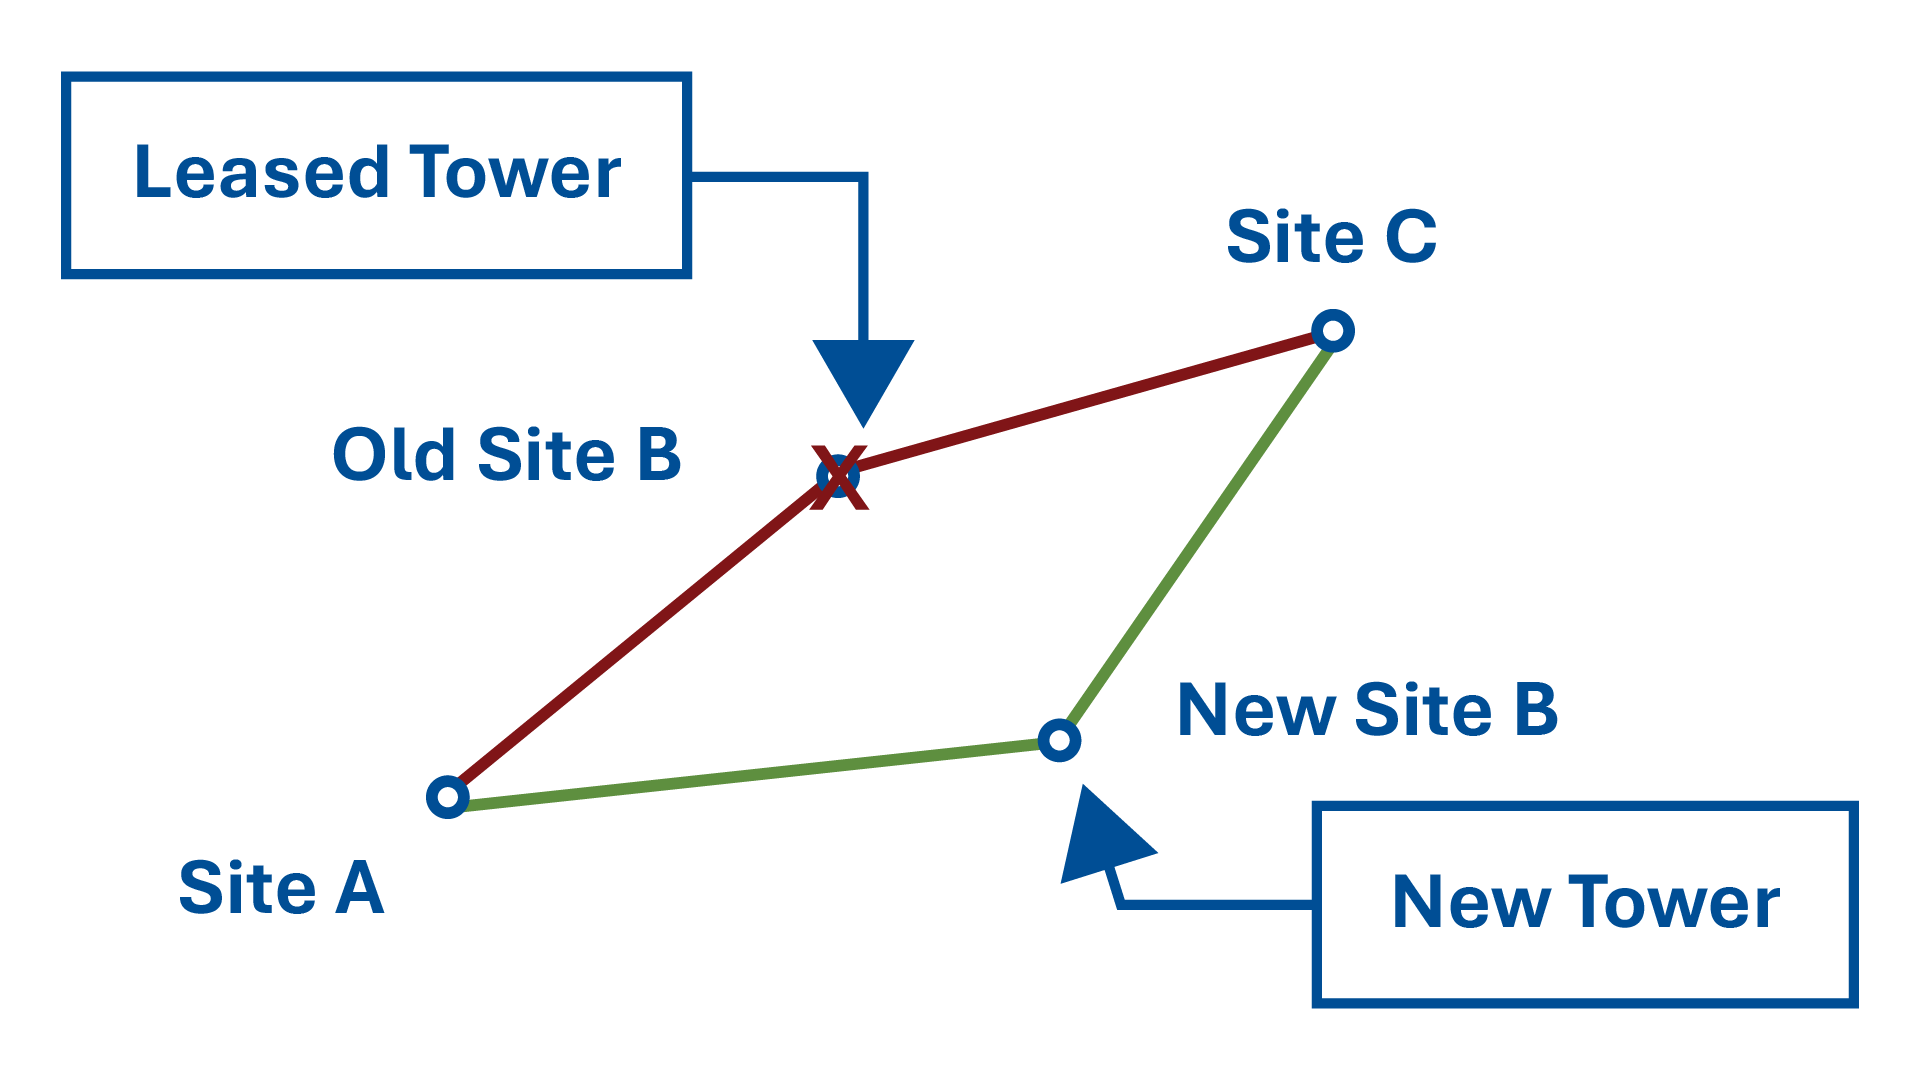
The efficient planning of microwave communication networks relies heavily on identifying optimal tower locations that provide clear, uninterrupted signal transmission. Traditionally, this has been achieved through point-to-point radio frequency (RF) studies, which analyze whether a proposed site provides the necessary clearances and signal strength for stable connections. However, when clients request new connection endpoints or when additional towers are needed to bridge long distances, these studies become time-consuming due to the large set of possible site locations.

Given the challenges and precision required in traditional individual microwave path planning, Burns & McDonnell developed a procedure to look at all locations at the same time that leverages existing RF tools in a novel way, resulting in faster deployment timelines and better network design outcomes.

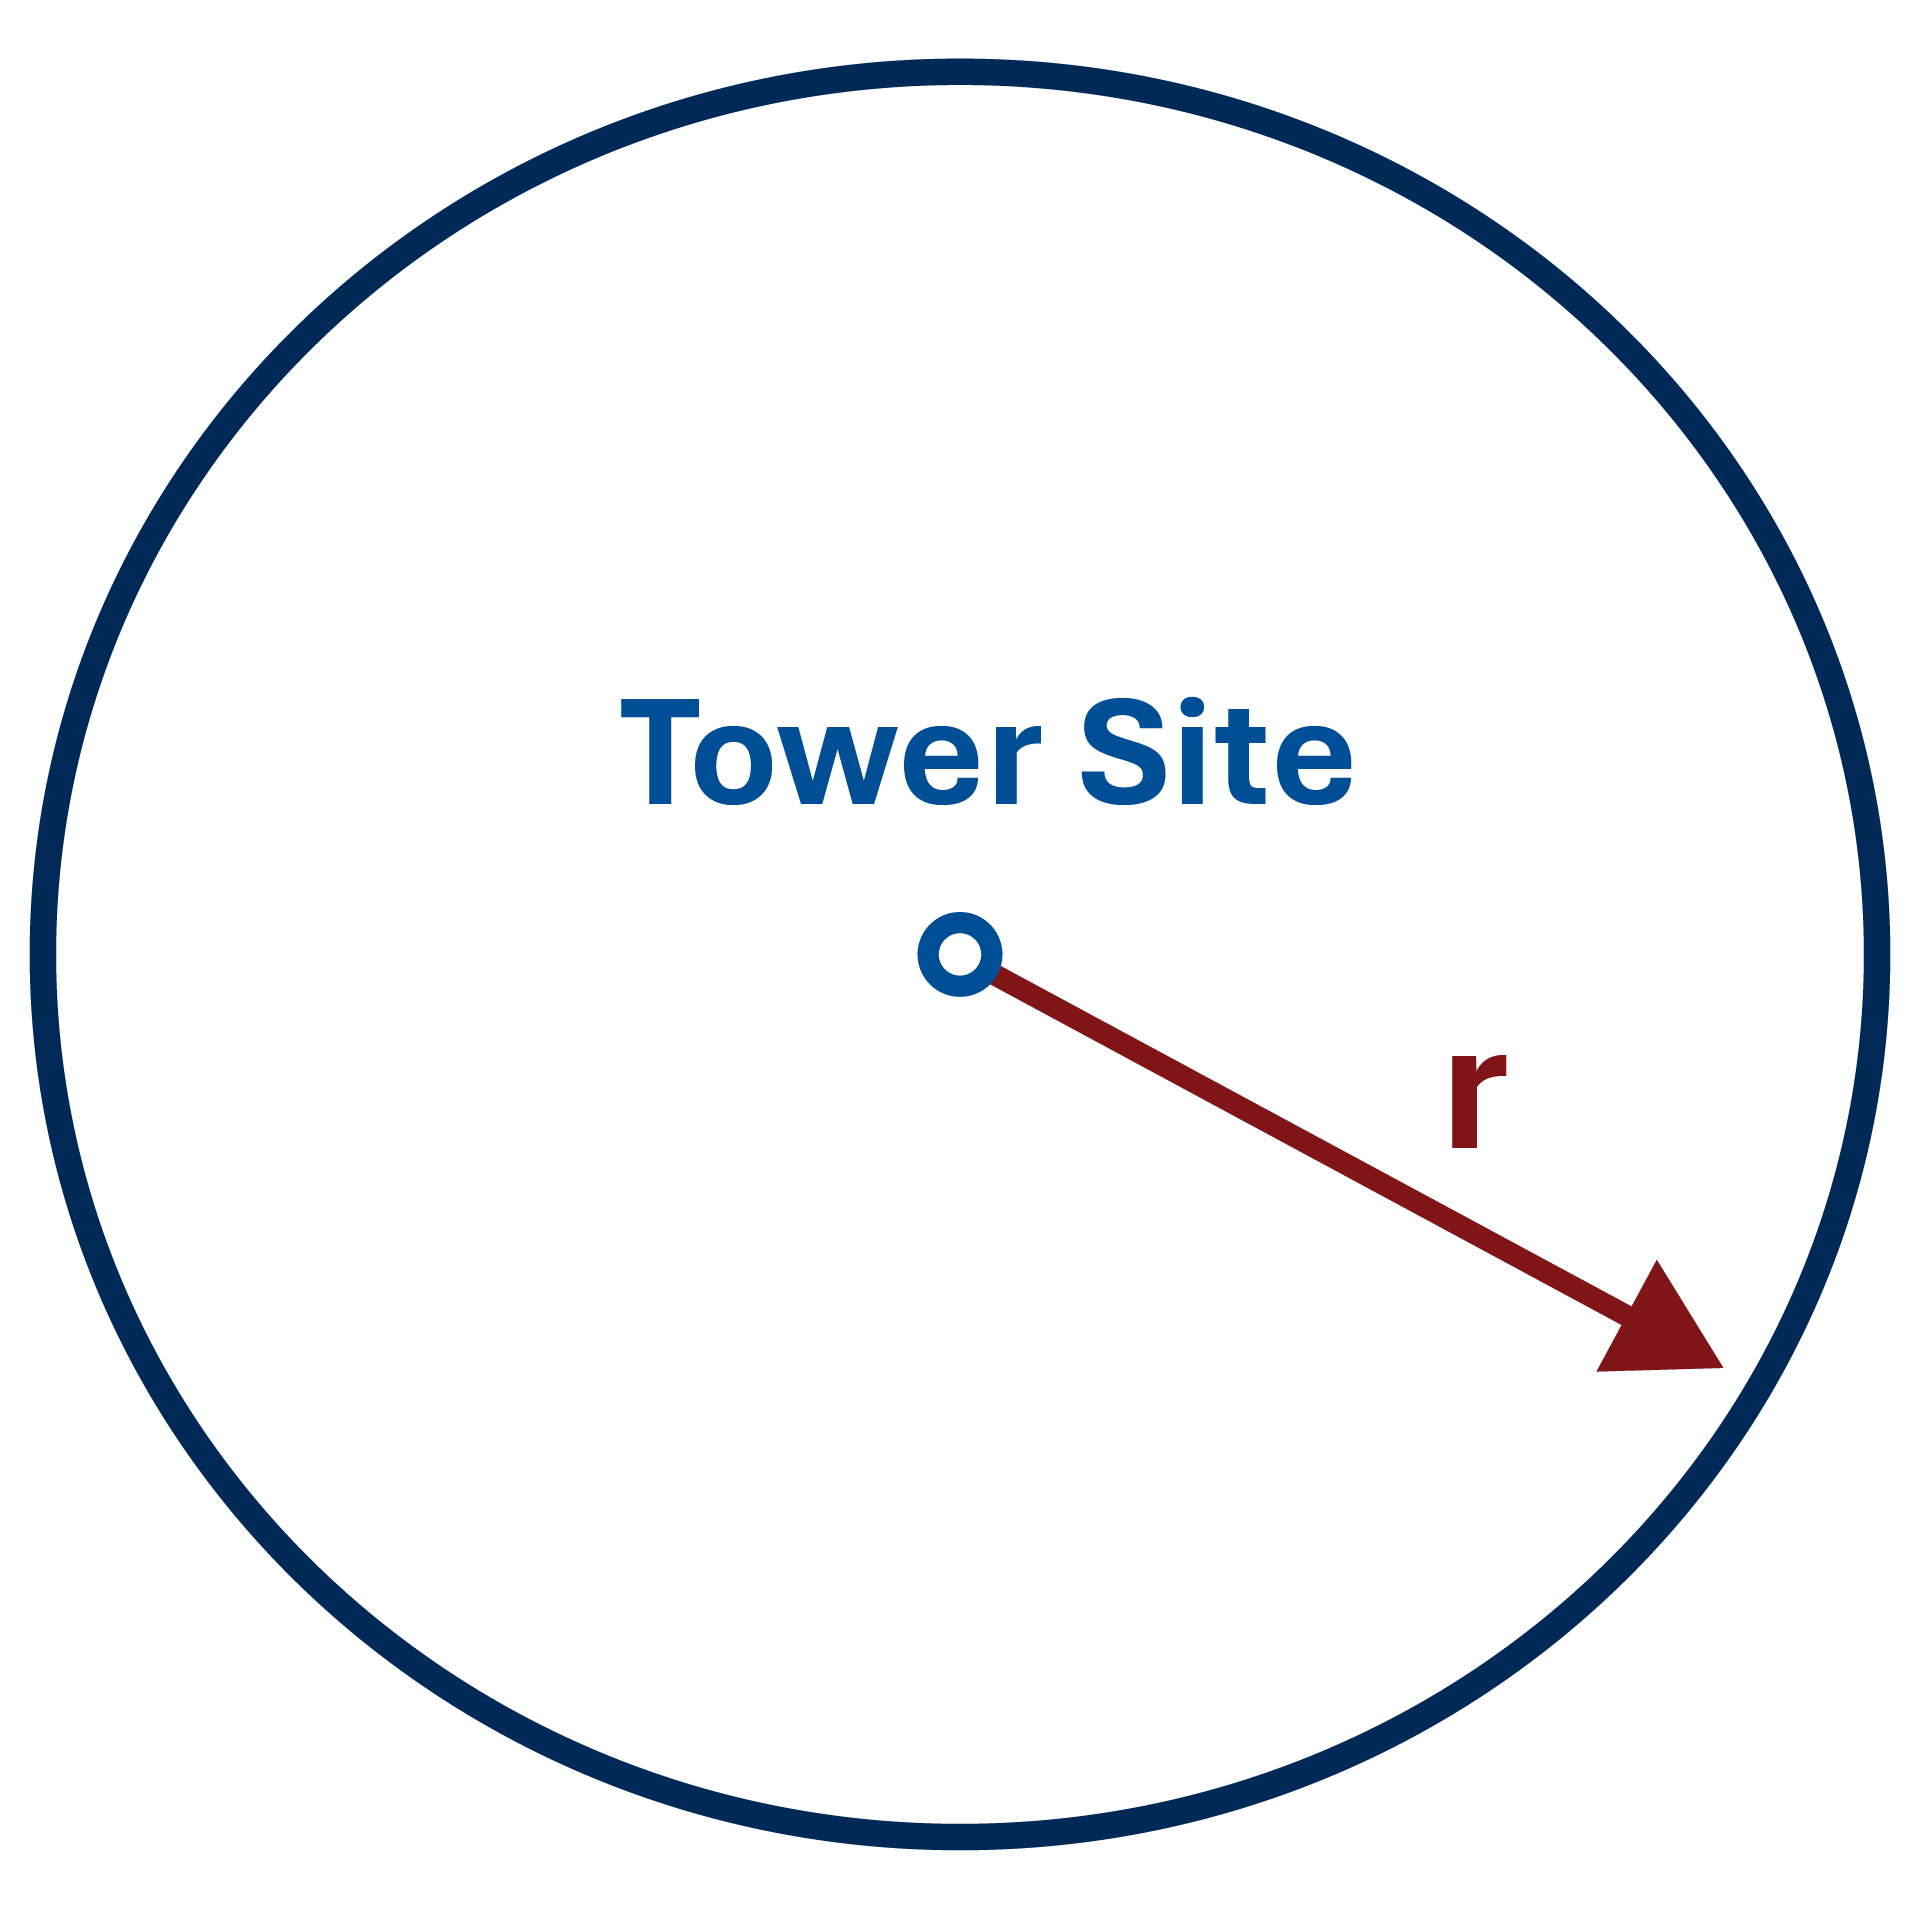
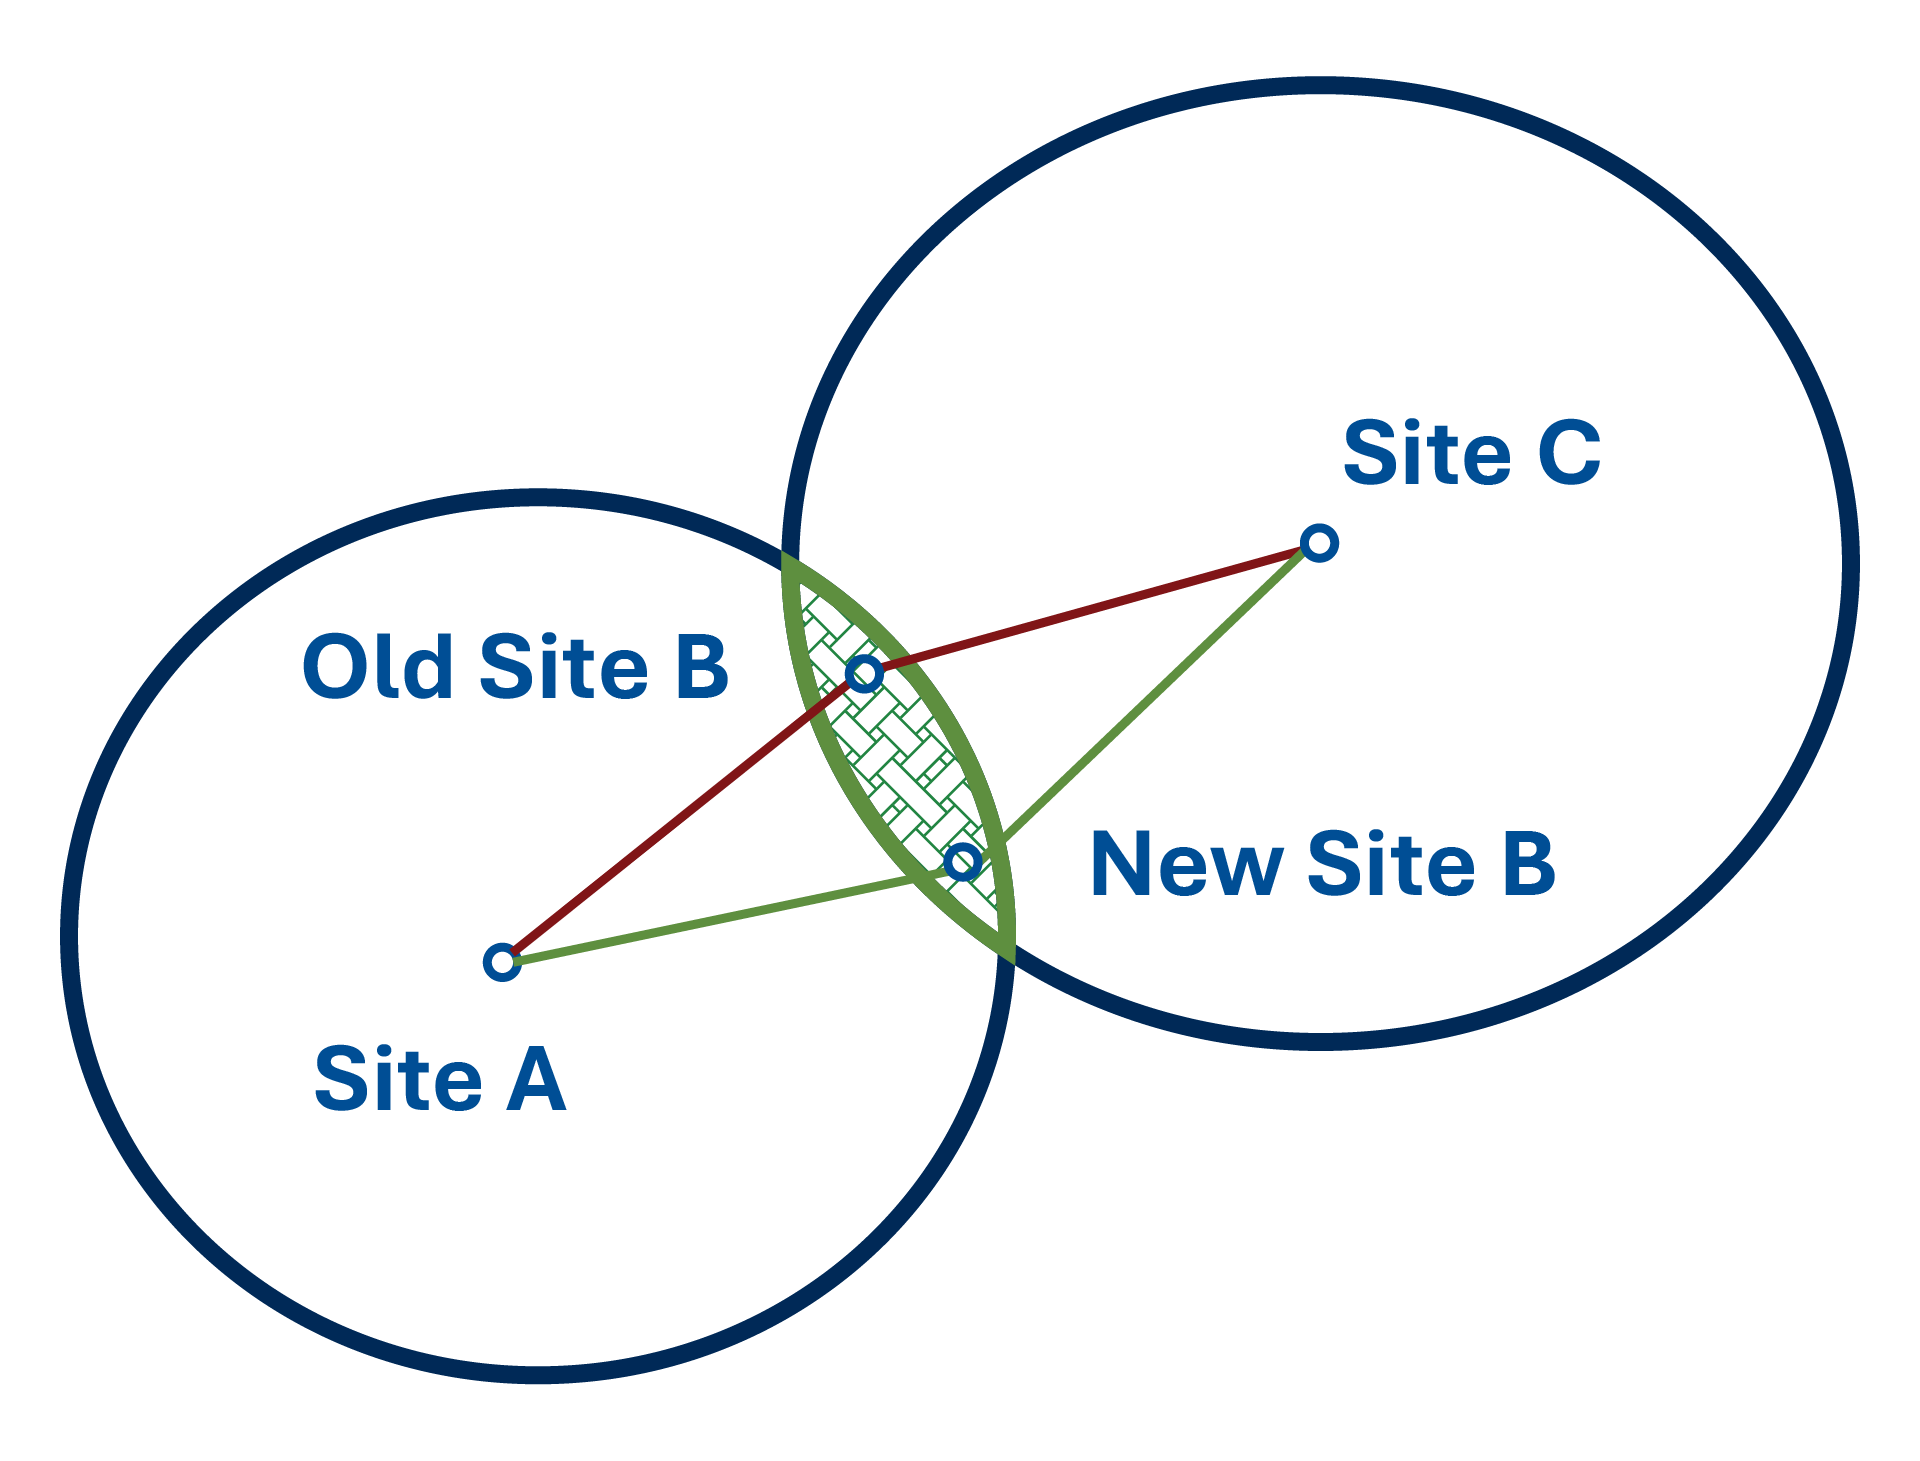
The unique method of overlaying RF coverage maps to pinpoint areas of overlap provides a distinctive strategy for identifying viable tower sites. It serves as a novel link between preliminary viability assessments and detailed location planning, streamlining the process while enhancing speed, precision, and budget efficiency. 

The Coverage Map Solution

To make the tower location selection process more efficient, it is important to begin with RF coverage maps, a tool typically used in mobile communications. By adapting these maps to reflect microwave-specific parameters, it is possible to prescreen large areas, identify potential line-of-sight paths and significantly reduce the number of infeasible candidate sites before initiating detailed point-to-point RF studies.

At the beginning of the design process, these coverage maps identify areas where tower parameters meet project requirements and help visualize signal strength. By adjusting map settings to match the requirements of point-to-point microwave paths, it is possible to quickly identify all locations where there is sufficient signal strength.

Using RF coverage maps at the beginning of the process reduces the time needed to evaluate sites, increases the likelihood of starting with viable locations and minimizes rework. Instead of waiting for a real estate team to propose sites based on elevation, a team can use coverage maps to pinpoint areas that meet the technical RF requirements, rather than just relying on where the site elevation is high or low. 

Traditional Method Challenges

Unlike cellular systems, which rely on omnidirectional antennas to spread signals across large geographical circular areas to communicate with mobile radios, microwave networks depend on precise, line-of-sight (LOS) links between towers in fixed locations. Obstructions such as buildings, trees, or terrain can disrupt connectivity, making accurate site selection essential.

Traditionally, microwave path design depends on point-to-point RF studies, which involve detailed terrain and obstruction analysis between two fixed points as shown in Figure 1. 

Figure 1: Point-to-point microwave paths must have Fresnel zones clear of obstructions to avoid losses to the signal. Calculations are performed to verify that terrain and obstructions, like trees or buildings, along the specific path do not encroach into the Fresnel zone. Antenna height at each location can be determined for that specific path.

CLICK TO ENLARGE

When clients want to build a new tower or move off of existing leased towers to a new unspecified location the traditional approach presents several challenges, primarily due to its time-consuming nature and lack of scalability. Each proposed site must be individually analyzed for terrain profiles, clearance assessments and height calculations. When endpoints change or repeaters need to be introduced, the entire evaluation process must be restarted. (See Figure 2.)

Figure 2: When clients want to move off an existing leased tower and build a new tower, choosing a new site is difficult because there are many potential locations. Doing point-to-point RF studies for each location is time consuming, often leads to rework and may not result in an optimal new location.

CLICK TO ENLARGE

Many locations initially considered for new towers ultimately fail feasibility checks due to obstructions or excessive link distances. This leads to repeated site assessments and the result is an extended cycle of rejected locations and prolonged network planning efforts.

Another significant limitation of traditional RF point-to-point studies is their focus on individual link assessments rather than a broader, regional analysis. As microwave networks expand, the manual evaluation of multiple sites becomes increasingly complex and resource intensive. 

The Case for Using RF Coverage Maps Early

Integrating RF coverage maps into the site selection process allows a highly directional microwave dish to be modeled as an omnidirectional source. This enables a broader coverage view not typically available in traditional point-to-point RF studies, bridging the gap between wide-area feasibility assessments and focused link analyses. It offers a better perspective for making informed decisions.

By configuring coverage maps to account for microwave-specific parameters such as frequency bands, antenna gain, antenna height and microwave radio parameters, it is possible to visually identify areas with a high likelihood of LOS connectivity. This prescreening step narrows down viable areas early in the planning phase, reducing the risk of failed assessments. Figures 3 and 4 illustrate how this method is applied by treating intermediate microwave sites similarly to mobile towers and performing RF studies from both far-end locations. 

Figure 3: Coverage maps are typically used to show the coverage area from a tower site out to mobile devices such as in land mobile radio (LMR) and cellphone systems.

CLICK TO ENLARGE

Figure 4: The process of identifying a suitable intermediate microwave site involves treating the location as a movable tower and performing RF coverage studies from both far-end stationary sites. This approach helps locate areas where both sites can connect reliably. Since results vary based on antenna height, transmit power, antenna size and terrain, all setup parameters must be clearly defined and shown on the maps for accurate interpretation.

CLICK TO ENLARGE

Case Study Implementation

To validate using the RF coverage map approach early in the process, Burns & McDonnell compared traditional point-to-point RF studies to the new approach that is assisted by RF coverage maps. The project team selected two far-end tower sites and set out to identify a viable intermediate site that could establish line-of-sight communication with both.

Initial Coverage Mapping

Rough boundaries for potential intermediate sites were created by drawing a 10-mile radius around each of the two far-end towers. This visual estimate helped predict where RF coverage areas were likely to overlap, as shown in Figure 5.

Figure 5: To estimate where the intermediate sites would be located, circles were drawn at a 10-mile radius to show where the coverage maps from each remote site would be expected to overlap.

CLICK TO ENLARGE

RF coverage maps were then generated for the far-end sites using microwave-specific parameters such as antenna gain, antenna height, transmit power, receiver sensitivity and fade margin thresholds. The resulting coverage maps visually represented areas with acceptable fade margins using a color gradient: blue and green signified good margins, while yellow to dark red indicated poor fade margins, as shown in Figure 6.

Figure 6: In this coverage map, fade margins are chosen to be displayed with blue and green being acceptable fade margins and yellow, red and dark red as unacceptable fade margins.

CLICK TO ENLARGE

Preliminary Site Selection Process

Using the overlap zone from the coverage maps, the team examined the terrain and fade margin distribution to pinpoint locations (indicated as pink circles) with non-obstructed signal paths and acceptable fade margin from both far end sites as shown in Figure 7. Coverage maps effectively reflected terrain obstructions such as mountain ranges (indicated as a pink straight line) that cause abrupt signal loss, seen as transitions from blue to red along specific paths.

Figure 7: Areas that go from blue (high fade margin) to red (low fade margin) indicate terrain characteristics (such as a mountain range) that cause the signal to be interrupted abruptly. The pink straight line shows a mountain range that blocks the signal. The two pink circles indicate locations where the two separate coverage maps overlap with acceptable fade margin. These two locations are in line with a valley in the mountain range that allows the RF signal to pass through as shown by the blue color on the left side of the pink line.

CLICK TO ENLARGE

In our example, a valley running through a mountain range permitted signal continuity, making two locations strong candidates for an intermediate site. The signal path through the valley is more clearly illustrated in the lateral view in Figure 8, while Figure 9 provides a close-up of the two potential intermediate sites identified based on acceptable fade margins.

Figure 8: The signal can be seen passing through the valley between the mountains in the lateral view.

CLICK TO ENLARGE

Figure 9: This image is a close-up view of the two locations where the two coverage maps overlap, indicating a good spot for the intermediate site. These preliminary sites would still need to be evaluated for land acquisition before they could be accepted as viable potential sites.

CLICK TO ENLARGE

Once sites were identified, the team conducted two critical regulatory checks. First, a Federal Aviation Administration (FAA) Notice Criteria review was performed that showed the proposed tower locations were not near an airport or within a designated glide slope path. This step was crucial for avoiding airspace violations or future construction restrictions. Second, a Federal Communications Commission (FCC) AM tower proximity check was performed to identify nearby AM radio broadcast towers to avoid signal interference risks. Both checks are essential to eliminate sites that could encounter permitting or operational barriers later in the deployment process.

Real Estate Coordination

Following the generation of coverage maps and regulatory checks, the information was forwarded to the real estate team. Using these maps as a guide, the team concentrated on identifying purchasable parcels within the viable coverage zones. This targeted approach streamlined the search process and avoided random site selection.

Refined Point-to-Point Analysis

After identifying suitable parcels, the team proceeded with detailed point-to-point RF studies for each candidate location to validate the assumptions made during the initial coverage mapping phase. Point-to-point analysis confirmed that each selected path had a clear Fresnel zone, acceptable fade margin and acceptable path availability.

Limitations and Recommendations

While the use of RF coverage maps significantly improves planning and site selection, certain limitations must be addressed in order to have optimal site selection results. A few of these include:

  • Coverage map precision. One limitation of coverage maps is that they assign a single value to an entire grid cell based on the calculated value at the cell’s center, even though slight fade margin variations may exist within that cell. As a result, the color resolution may not always accurately reflect subtle transitions in fade margin values.
  • Lack of Fresnel zone analysis. Cellular coverage maps typically do not account for Fresnel zone clearance, which is critical for microwave links. Even if a map shows signal presence, it doesn’t mean the path is unobstructed through the entire Fresnel zone.

Despite the challenges posed by these constraints, a few key practices and recommendations can still be effectively implemented, including:

  • Conduct point-to-point study. While coverage maps are reliable and a great way to start the selection process, conducting a point-to-point RF study remains essential to validating selection results with higher precision.
  • Avoid inaccurate conclusions when analyzing results. Coverage map results are dependent on the input parameters such as frequency, antenna height, antenna gain, transmit power, radio model and configuration. Users must keep these parameters in mind when interpreting the coverage maps to avoid drawing inaccurate conclusions about signal viability.
Smarter RF Mapping for Faster Network Planning

The process of identifying viable microwave tower locations has traditionally relied on point-to-point RF studies for each prospective site. However, when evaluating a large number of potential sites, this method can be time-consuming and labor-intensive. Each site must be analyzed individually to confirm viability, which can lead to inefficiency during the early planning phase.

Ultimately, the technique of overlaying RF coverage maps to find where there is overlap as a way to reduce feasible tower site count is unique and bridges the gap between high-level feasibility analysis and site-specific engineering, enabling faster, more accurate and cost-effective results.

By adapting RF coverage maps early in the site selection process to reflect microwave-specific parameters, it is possible to screen large areas, identify potential line-of-sight paths and significantly reduce the number of infeasible candidate sites before initiating detailed point-to-point RF studies. This methodology leverages powerful tools like Pathloss to take full advantage of features such as real-world map visualization and automated modeling.

As the demand for scalable wireless infrastructure continues to grow, incorporating RF coverage maps earlier in the network planning process represents an innovative approach that plays a vital role in efficient early-stage planning and optimized network expansion.

Cool Video Headline Goes Here

Video Column Complete

video description goes here. video description goes here


Authors

Faiza Khan

Assistant Electrical Engineer

Terrence Sullivan

Senior Electrical Engineer