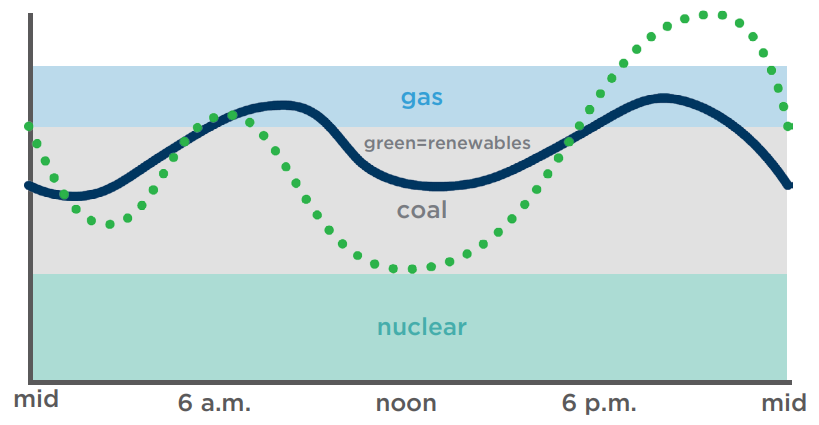
As solar and wind expand across the country and coal generation declines, one of the biggest challenges facing electric grid operators is accurately explained by the duck curve made famous by the large renewable build-out in California over the past decade.
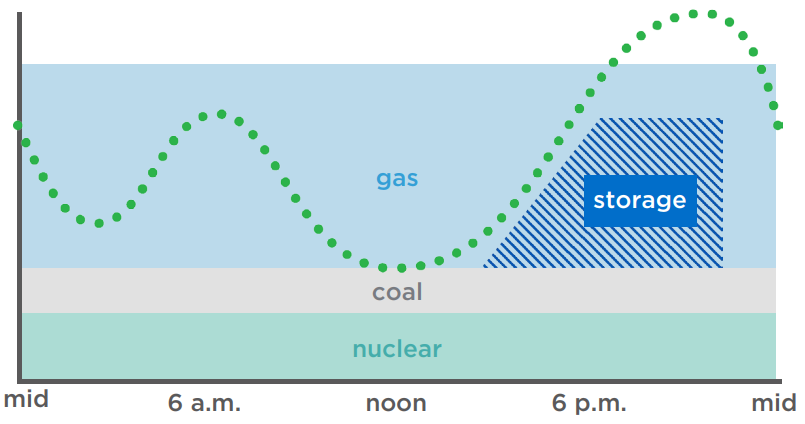
Named for its resemblance to the waterfowl’s profile, the duck curve illustrates the imbalance between peak energy demand and renewable energy production. It occurs because solar power floods the market when the sun is shining and demand trends lower (forming the belly of the duck), before dropping off at nightfall when electricity demand peaks (illustrated by the duck’s head). Therefore, a grid operator’s challenge is finding a way to fill in the gaps with dispatchable resources.
The duck curve also demonstrates why solar power must be “firmed,” that is, supported by reliable energy sources that can be dispatched quickly to deliver power on demand. These dispatchable sources are typically needed during peak demand hours each day, as well as larger, multiday and seasonal gaps created by sustained low-sun conditions. They can also be required on a moment’s notice when the wind stops blowing or a cloud appears overhead. The rolling brownouts and blackouts California experiences periodically highlight what can happen in extreme circumstances when there are not enough dispatchable resources available and grid operators have to reduce or restrict electrical power temporarily.
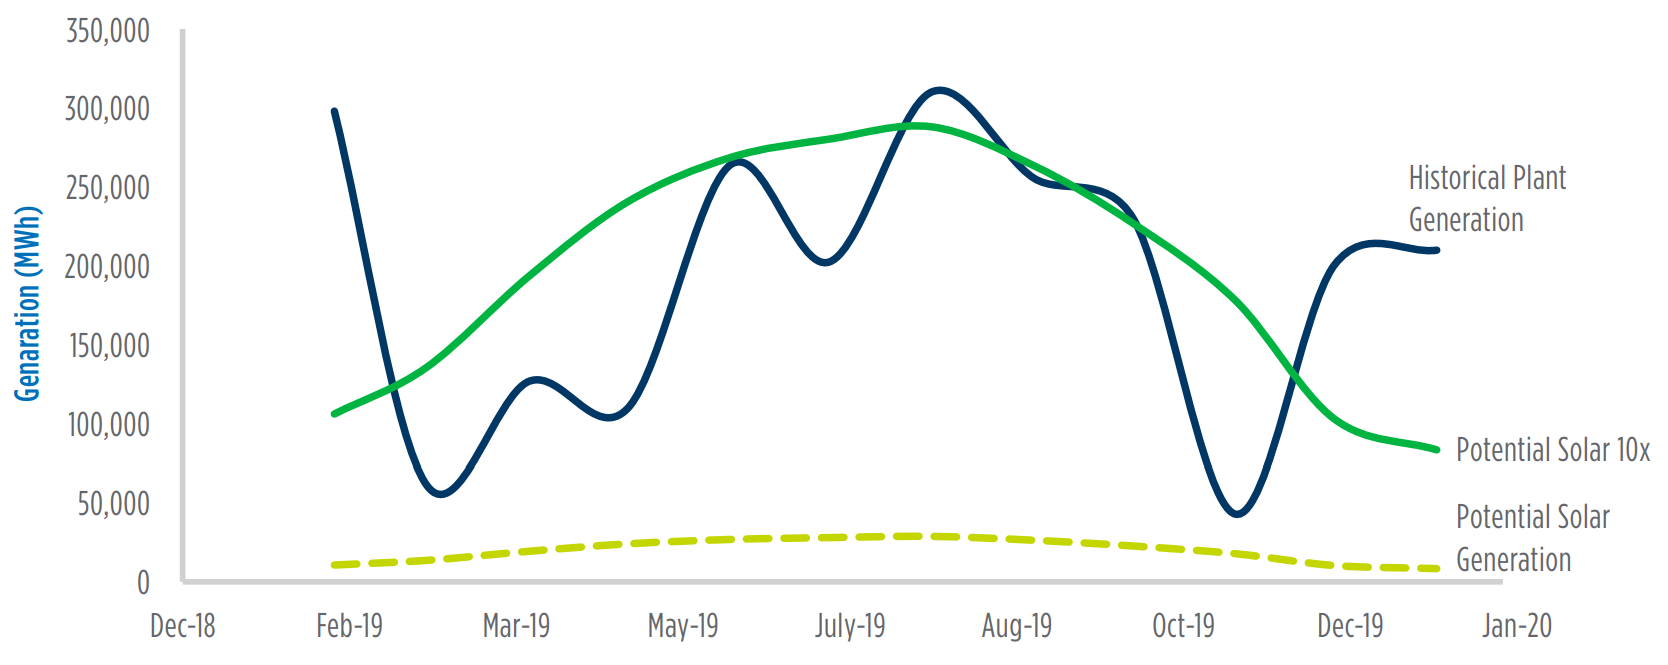
For example, a review of Midcontinent Independent System Operator (MISO) data on demand and renewable generation in select spring, summer and winter periods over a recent 18-month period found that the duck curve is greatest in the summer, when demand is 50% higher than cooler shoulder months. Winter averages produced a flatter demand curve.


