Transportation engineers and planners have historically relied on crash data to understand traffic safety and identify high-crash locations and patterns in crash characteristics. Once problematic locations or conditions are identified, resources can be allocated to mitigate future crashes by educating drivers about specific risks, changing the roadway or roadside conditions, or increasing enforcement. This traditional approach is an important tool in the transportation safety toolbox, but it is inherently reactive, because improvements are only made once enough crashes have occurred to highlight a problem.
More recently, research has focused on understanding the factors that make crashes more likely. The Federal Highway Administration (FHWA) has provided and promoted tools for transportation agencies to expand their understanding of data-driven safety analysis (DDSA), which moves the field of traffic safety from the reactive practice of identifying high-crash locations toward proactive safety management approaches intended to mitigate potential crashes before they happen.
One application of DDSA is the systemic safety management approach. This type of analysis uses both roadway and crash data to identify lower-cost safety improvements that can be applied in many locations. Transportation engineers understand that crashes resulting in serious injuries and fatalities are rare and can be random. The locations where crashes occur are different from year to year. Consequently, improving a single location where a fatality occurred is not very likely to save the next person’s life. Instead of focusing on locations with a crash history, a systemic analysis identifies the risk factors correlated with specific types of crashes and addresses them with lower-cost improvements, such as upgraded pavement markings, curve widening, more reflective signage, lighting for intersections or rumble strips. The safety benefits of a systemic approach are distributed broadly across the network to prevent future crashes.
Another application of DDSA is the use of predictive tools to identify where crashes may happen in the future. In 2010, the American Association of State Highway and Transportation Officials (AASHTO) published the first edition of the Highway Safety Manual, which included models to predict the number of crashes that would occur on a section of roadway based on the traffic volume and specific characteristics like shoulder width, curve radius and presence of lighting. These models help safety professionals design new facilities to minimize crashes, prioritize improvements to existing roadways expected to have the biggest safety impact and identify locations that are performing worse than expected.
Unfortunately, even with the availability of these tools to help designers and planners make data-driven decisions to maximize safety, the number of roadway fatalities continues to rise. In 2020, the National Highway Traffic Safety Administration (NHSTA) reported 38,824 auto fatalities. In 2021, that number increased to 42,915. That was the largest number of traffic fatalities since 2005 and the greatest annual increase in the history of the Fatality Analysis Reporting System.
Transportation engineers and planners have historically relied on crash data to understand traffic safety and identify high-crash locations and patterns in crash characteristics. Once problematic locations or conditions are identified, resources can be allocated to mitigate future crashes by educating drivers about specific risks, changing the roadway or roadside conditions, or increasing enforcement. This traditional approach is an important tool in the transportation safety toolbox, but it is inherently reactive, because improvements are only made once enough crashes have occurred to highlight a problem.
More recently, research has focused on understanding the factors that make crashes more likely. The Federal Highway Administration (FHWA) has provided and promoted tools for transportation agencies to expand their understanding of data-driven safety analysis (DDSA), which moves the field of traffic safety from the reactive practice of identifying high-crash locations toward proactive safety management approaches intended to mitigate potential crashes before they happen.
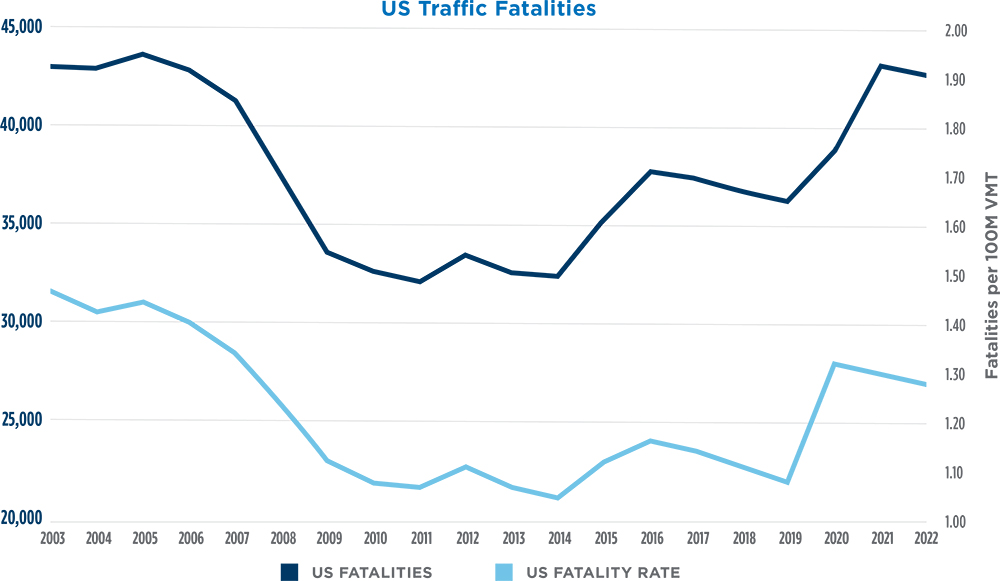
Figure 1: Data from the National Highway Traffic Safety Administration shows that in 2021 the number of auto fatalities reached its highest level in 16 years.
The increase in traffic fatalities during the COVID-19 pandemic illustrates a limitation in crash prediction models. The models are based on the physical characteristics of the roadway and traffic volumes — inputs that are both easy to obtain and that represent crash risk factors that transportation agencies have the ability to change. But most crashes occur when multiple risks align, and those risks often include driver errors or unsafe choices, vehicle limitations, weather and other non-infrastructure factors, which the models assume remain constant over time and from one roadway to the next. The pandemic presented major changes in travel patterns — including less commuting and more personal travel during off-peak periods — and driver behavior — for example, an increase in speeding and impaired driving and a decrease in seat belt use. These factors, and potentially others, likely played an important role in the increase in fatalities during 2020 and 2021 but could not be accounted for in the crash prediction models.
The continued rise in fatalities and the limitations of predictive models point toward a need for even more robust data to help identify safety concerns before they result in serious injuries and fatalities.
The Human Factor
In 1979, Indiana University published a groundbreaking study indicating that human factors led to or contributed to 93% of crashes reported. Subsequent studies have reinforced what is now considered common knowledge among transportation engineers and planners: The roadway user (i.e., driver, cyclist or pedestrian) plays a significant role in crashes. Transportation safety is influenced by multiple factors, including the design of the infrastructure itself, but if human factors influence most crashes, designers and traffic engineers must be acutely aware of how roadway users perceive and respond to the transportation environment.
Traffic crash reports can provide some information about what led to a crash, but the descriptions included in the report are filtered by the facts considered most relevant by the reporting officer, and some crashes go unreported if a law enforcement response was not needed or called. Law enforcement agencies and emergency responders can often provide insight regarding the locations or conditions where drivers tend to engage in risky behaviors. But even with all this information, it can be difficult to understand how characteristics related to the infrastructure, conditions, vehicle and driver converged at the same time and location, allowing the crash to happen. Understanding the experience of the roadway user, from their own perspective, helps create a more robust picture of what might be contributing to crashes.
Roadway safety audits (RSA) are one tool for assessing safety concerns and crash mitigation strategies. RSAs are performed by a multidisciplinary team that looks beyond design criteria to identify conditions or features that could be problematic for roadway users, and then recommends mitigations for the identified problems. However, unless the RSA includes those who use the roadway on a regular basis, it will likely miss areas of concern and opportunities for improvement. Even with the inclusion of roadway users, the perspective will be limited to only a few participants.
Roadway user surveys can supplement a traditional RSA by recording the concerns of a larger constituency and paint a more robust picture of potential safety hazards, which can lead to better targeted solutions.
Developing an Effective Survey Tool
Roadway agencies can use surveys to better understand the factors impacting safety at a specific location, along a corridor, across a city or for a broader roadway network. The questions on the survey, delivery method and distribution strategies depend on what the agency hopes to learn from the survey — and, more importantly, what it plans to do with the findings.
Public works departments, state departments of transportation and turnpike authorities can develop and administer a survey, depending on their comfort level and knowledge of survey tools and methods. Another option is to collaborate with a reliable research or consulting firm to design the survey and analyze the results. Third-party agencies can also assist with survey distribution to reach a targeted audience. While an outside organization can prepare the survey, it is important to consider which entity distributes the survey. For example, a transportation agency may have contact information for those who regularly engage with the agency or who have purchased toll passes. This information makes it possible for the agencies to distribute the survey to those who are likely to respond. The agency may also have its own website to accommodate and promote online surveys. Additionally, when contemplating how the survey should be distributed, the agency should consider sending the survey from an entity known and trusted by the target audience, whether that is the transportation agency, an elected official, a local safety coalition or a respected private third-party company.
Survey methods and instruments should be accessible to those using the transportation facility. Often, web-based surveys can reach many roadway users and provide flexibility for completing the survey when it is convenient. For some groups, access to a computer or the internet may be limited, so formatting digital surveys to display well on smartphones can provide a more accessible option. Additionally, considerations should be made for non-English speakers, users with limited vision and individuals with other impediments to completing the survey. Alternative formats may include mailed surveys printed in multiple languages, telephone surveys, intercept surveys (i.e., in-person interviews at the location of interest on the transportation system) and focus group discussions.
Surveys conducted to assess public perception of safety don’t need a statistically significant sample size, but in most instances, having more respondents will provide better information. Transportation agencies and research firms use these surveys to collect supplemental information to enhance crash and roadway data. Decisions are generally not made on the survey data alone; rather, survey data serves to supplement traffic crash and roadway characteristics data to create a more complete picture of safety issues and concerns. The survey questions are typically focused on qualitatively understanding the perspective of the user rather than on quantitatively measuring the impact or response to specific roadway features or safety programs.
Survey designers should consider how the survey results will be used and what information would be helpful for improving safety by asking:
- Will results be shared with other agencies responsible for education and enforcement to help them tailor programs targeting specific behaviors?
- Are the results going to be used to inform the design of an upcoming project, help shape new policy, or verify the findings of a crash-based analysis?
- Will the results be shared with high-level decision-makers, designers and engineers, or the public?
- Is there a need to prioritize the locations for implementation of a specific safety treatment?
- Would the public benefit from hearing about ongoing safety improvements, especially if the improvements are not highly visible or well-publicized?
- Are there any sensitive topics that should either be highlighted or avoided altogether?
Survey questions should be designed to identify concerns that the agency has the means and desire to address. It is also important to consider question and response format, such as a Likert scale, multiple-choice or open-ended, because the format can impact how the question is perceived and the likelihood of getting a meaningful response.
Some surveys incorporate interactive maps, which allow respondents to drop a marker at locations of concern and leave comments regarding the specific issues they would like addressed. A static map with labels can also provide an opportunity for users to pinpoint or rank locations or movements of concern.
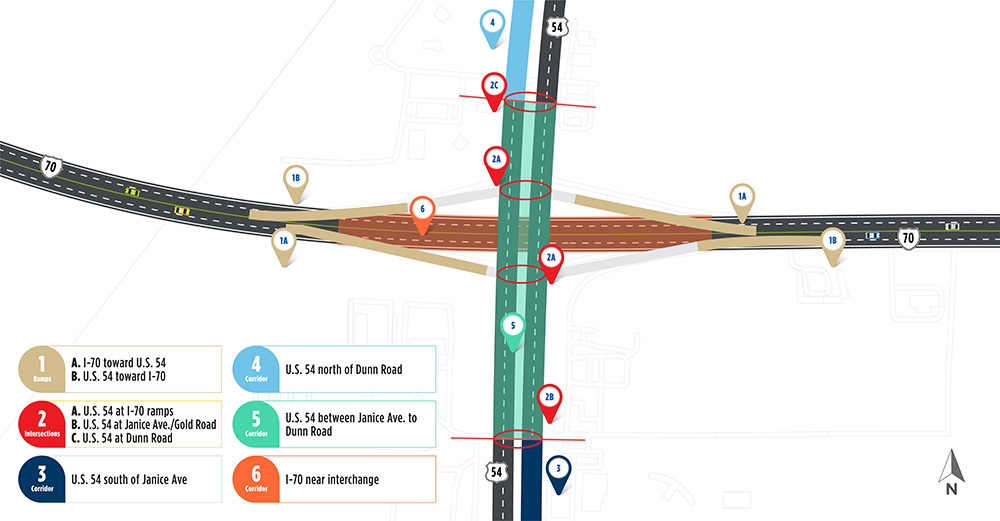
Figure 2: Example of a static map asking users to identify locations where they experience safety concerns.
Generally, information about a respondent’s age, where they live, if they work outside the home and how often they use the transportation facility in question can help the agency assess the relevance of the response. Surveys may ask for a respondent’s name and contact information and ask if the person would be willing to provide additional information. All questions should be optional for the respondent to answer. Surveyors do not want to miss answers on later questions because a respondent didn’t want to answer an earlier question.
Sending out a safety survey to roadway users, business owners and residents provides an opportunity for agencies to ask additional questions. Agencies may be interested in getting feedback on capacity issues, economic development, sustainability or resiliency. Including these questions in a survey has the potential to help agencies build programs and funnel resources to address the top concerns of their constituents. Conversely, if there are too many questions posed, the administering firm or agency can expect lower completion rates. Generally, surveys should not take more than seven or eight minutes to complete.
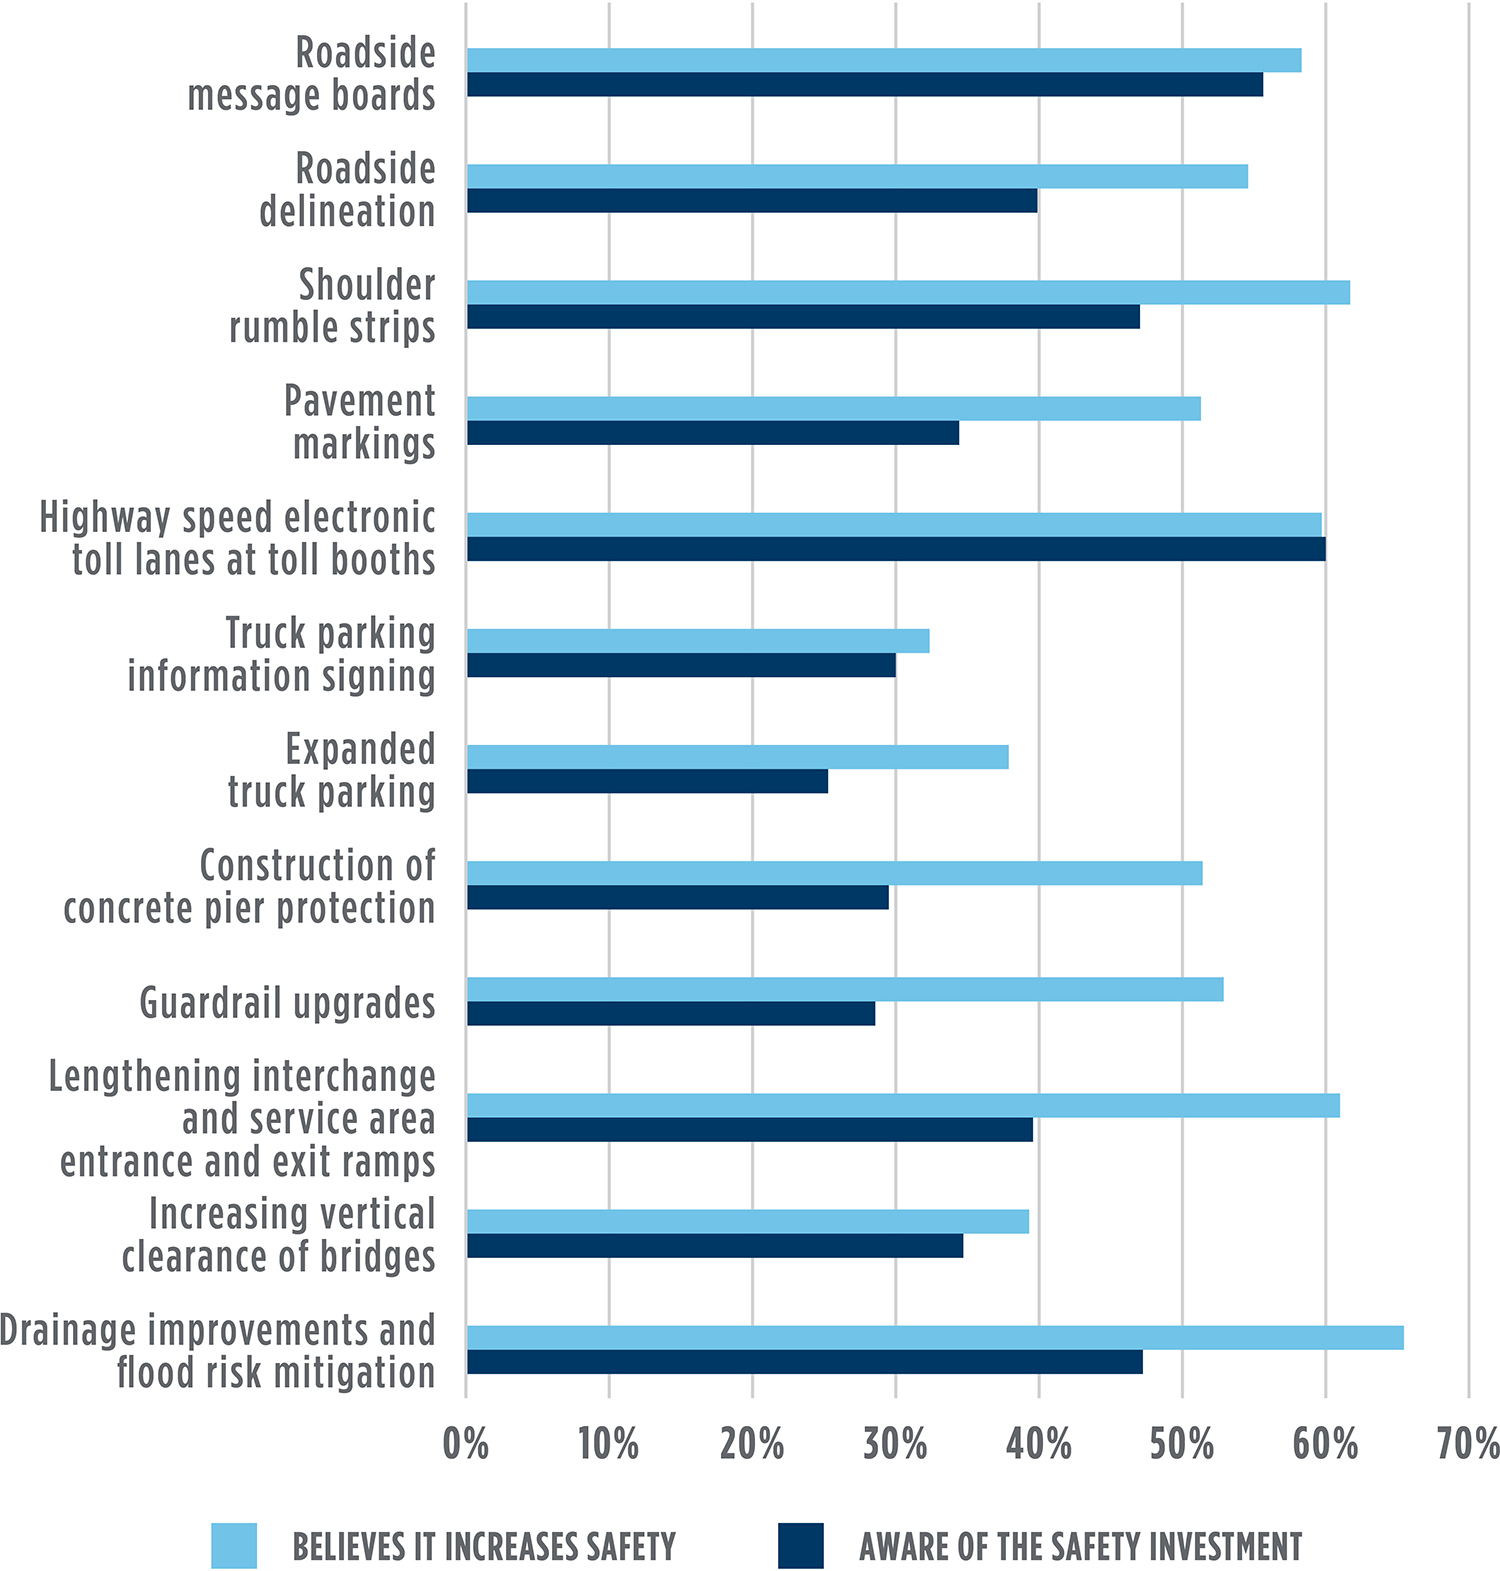
Figure 3: Survey responses indicate that promoting the agency’s current safety initiatives may increase the perception of safety among roadway users.
Interpreting Survey Results to Identify Solutions
Carefully designed surveys can supplement or explain trends and areas of concern identified from a detailed crash data analysis. A crash data analysis may indicate that left-turn collisions are prominent at a specific intersection, but it may not provide much information regarding why, leaving safety professionals to guess the underlying causes and solutions. Survey responses could reveal any number of causes that would each have different applicable countermeasures. Some examples include:
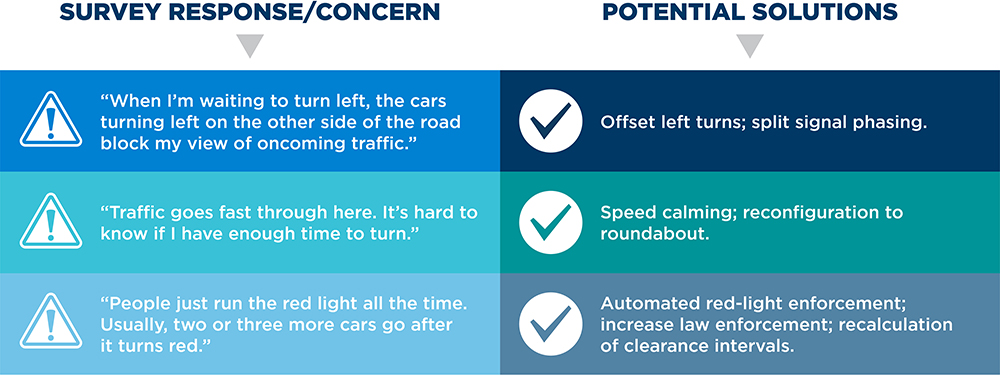
Figure 4: Concerns raised by roadway users and potential countermeasures to improve roadway safety.
Individual driver perceptions should not replace engineering knowledge and judgment. However, when several people describe similar concerns, engineers can use that information to assess which safety improvement is likely to have the biggest impact. Similarly, surveys can provide information about roadway users' priorities for improvements. Focusing on changes that are both impactful and desired by the community can earn goodwill and support for future efforts.
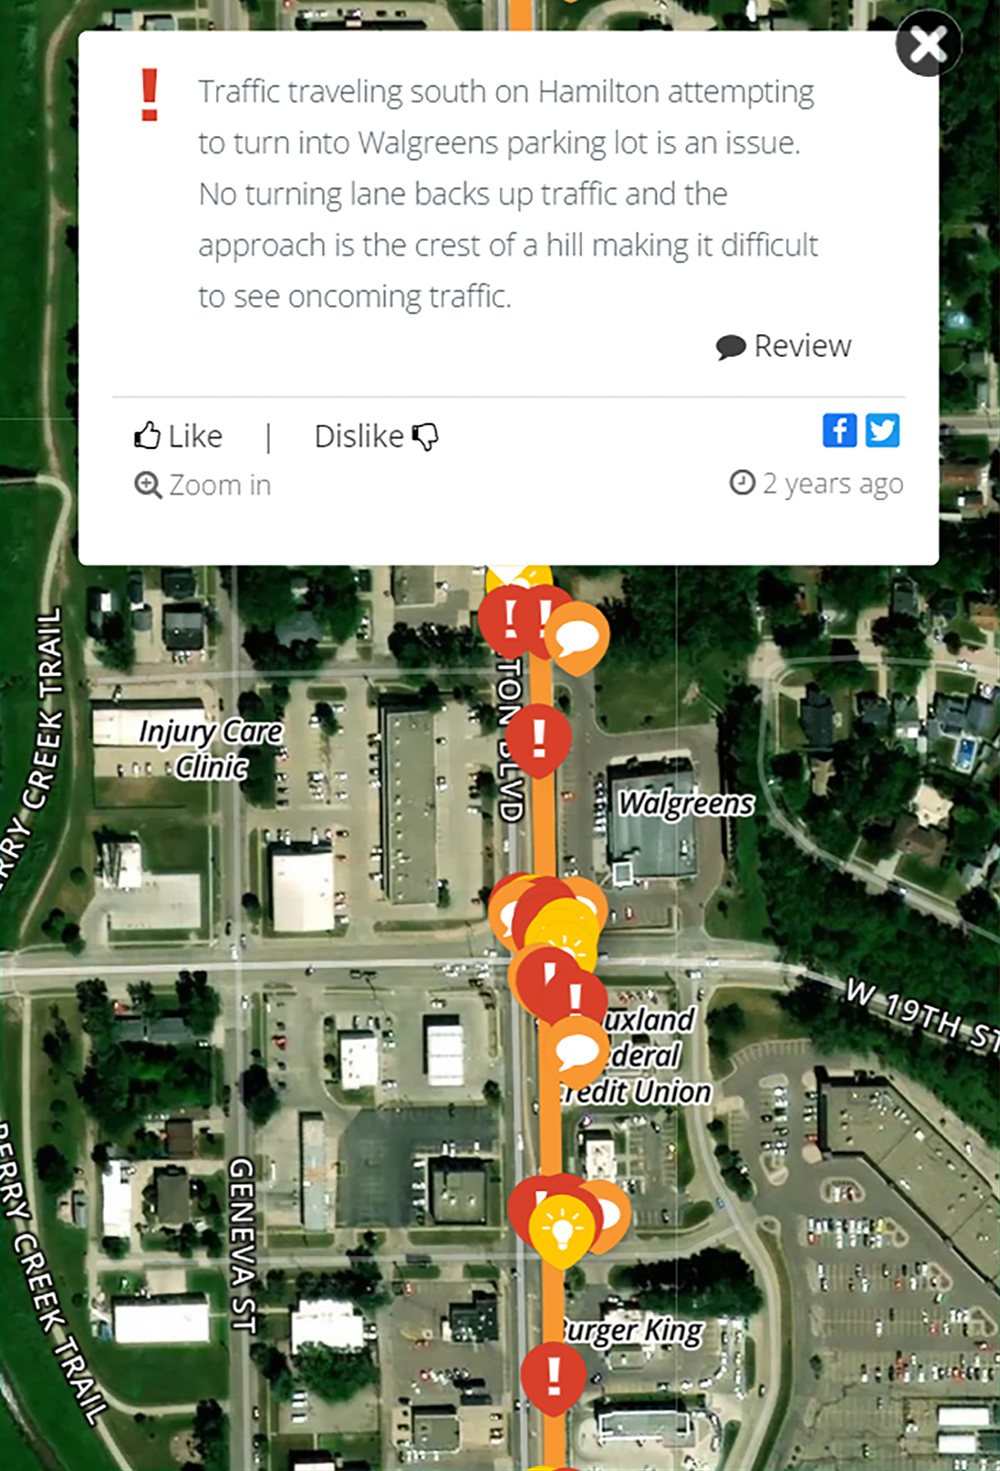
Figure 5: When survey data is spatial in nature, it is helpful to overlay locations of concern identified in survey results with crash data. Transportation agencies can prioritize projects where datasets overlap.
If survey data is spatial in nature, it can be helpful to overlay locations of concern identified in the survey with crash data or roadway characteristics data. Locations where datasets overlap can be prioritized for further safety analysis and improvement considerations.
Sharing survey results with other agencies and departments whose work impacts the roadway network can provide additional opportunities to execute safety improvements. For example, if planned utility work will require roadway reconstruction, safety improvements could be implemented as part of that project, even if the transportation agency had not originally prioritized the improvements. Interested parties who support public education and advocacy activities can be relied on to share the findings of the survey and promote the planned improvements. In addition, bringing a diverse group of people to the table can minimize the negative impacts of well-intentioned safety treatments, especially as some roadway user groups could be unintentionally overlooked. Partners responsible for policy and legislative agendas can use survey results, along with recommendations from transportation agencies, to identify policy changes that support specific safety needs in the community.
Prioritizing Safety Improvements
Surveys of road users invite the public to be part of the safety management process. Sharing the results of the survey back with the community to show how the findings will guide safety improvements fosters trust between the public and the agency. Survey data can also improve project prioritization for safety programs.
Traffic and transportation engineers working on roadway safety projects can use a combination of survey data, crash data, roadway risk factors and engineering judgment to determine appropriate safety strategies and appropriate locations for implementation. Engineers can also assess the likely benefit of these treatments, focusing on expected crash reduction due to the treatment. These benefits will be compared to the cost of implementation for design, construction and maintenance to determine the potential safety-related return on investment for each project.
This information is frequently used for project prioritization. However, survey data can be another prioritization input to expedite projects that the public feels strongly about. Other considerations for project prioritization often include available budget, coordination with other programmed projects, equity considerations and lead time required for right-of-way or equipment purchase.
While it may seem counterintuitive to prioritize projects based on support rather than on estimated benefit-cost ratios, agencies often find the safety treatments with the biggest impact are those supported by the community. When users value the safety improvement, they are more likely to change their own behavior to support successful implementation. Genuine coordination with drivers, riders, walkers, cyclists, business owners and advocacy groups will help strengthen the safety culture around the transportation network.
Using Surveys to Communicate Safety Improvements
A transportation agency demonstrates to roadway users that it cares about safety when a survey is used to supplement DDSA. Often, safety planning, design and implementation go unnoticed, especially if the improvements are focused in areas with less traffic or the treatments are not generally understood by the public to be safety improvements, such as shoulder widening, interchange ramp improvements, drainage improvements or lighting improvements. Surveys provide an opportunity to highlight work that has already been done and promote the types of treatments that are being considered. They can help the public connect the dots between the inconveniences of roadway work and the long-term safety improvements resulting from those projects.
Surveys can be promoted through press releases or featured on an agency’s website. Agencies can also promote surveys in local news stories, in neighborhood newsletters, on community boards or on social media. No matter the size or type of survey, a thoughtful communication plan should be developed to identify target audiences and distribution strategies, coordinate messaging to align with communications plans for other projects and programs, and plan how survey results will be communicated back to the agency and the public.
Conclusion
DDSA has evolved to better identify safety needs, select appropriate treatments and estimate the potential benefits of those treatments in terms of reduced crashes, injuries and fatalities. Numerous tools have been developed to quantify safety risks and benefits. But despite the increasing use of these quantitative methodologies across the transportation safety profession, fatalities have increased substantially in the past several years. The COVID-19 pandemic brought about a rapid shift in driver behaviors. Safety professionals are working diligently to improve the analysis and decision-making tools required to identify the most pressing needs and the most impactful treatments.
Surveys of transportation system users can supplement traditional safety analyses and provide context to understand the “why” behind the patterns seen in the crash data. Understanding the human factors contributing to severe crashes can help roadway designers and traffic engineers target the safety improvements expected to provide the greatest benefit. In addition, surveys provide an opportunity to engage the public in the safety management process and build a stronger safety culture.
How survey results are communicated and put into action — through safety project programming and implementation — is critical to maintaining continued collaboration among the transportation agency, the public and other interested parties.