OVERCOMING RENEWABLE ENERGY OBSTACLES WITH RECIPROCATING ENGINES

BY Brian Elwell, PE, AND Kieran McInerney, PE

As the demand for flexible, efficient electricity rises, the market is beginning to recognize the compatibility of reciprocating engine generators with the intermittent energy supply created by wind and solar.

Read The White Paper

INTRODUCTION

Today’s dynamic power industry is increasingly in need of flexible, efficient electricity generation. The days of predictable peak demand patterns are behind us. As wind and solar energy sources continue to penetrate the market, their intermittent energy supplies could present obstacles for Independent System Operators (ISOs) when balancing loads and maintaining frequencies — and often intensified at sub-transmission voltages.

Recent market trends demonstrate reciprocating engine generators are compatible with flexible peaking and intermediate generation needs with an output range of 20-300 megawatts (MW). Reciprocating engines offer competitive heat rates and multi-shaft reliability for energy markets, as well as industry-leading ramp rates and startup times for ancillary services markets. This paper will highlight market factors driving the growth of reciprocating engines and compare it to other generating options.

THE RECIPROCATING ENGINE COMPARISON

Utility-scale engine models include the 9-10 MW and 18-20 MW unit classes, which are heavy duty, medium speed (514-900 rpm) engines that can easily adapt to grid-load variations. Figure 1 shows expected net output and heat rate values from three peaking plant options: a 220 MW reciprocating engine plant based on the 18-20 MW unit class, a 2x 100 MW aeroderivative gas turbine (GT) plant and a 1x F-class frame GT plant. A 1x1 F-class combined-cycle is included to show how these options compare to an indicative option for intermediate load dispatch.

fig1-chart

FIGURE 1: Performance comparison based on 59°F and 60 percent relative humidity at 1,200 ft. elevation, natural gas fuel, higher heating value (HHV) performance. Evaporative coolers running for GTs. Base load, unfired operation for combined cycle.

image001

FIGURE 2: Summer Heat Rate Curves, Btu/kWh (HHV). Based on summer conditions of 95°F and 50 percent relative humidity.

The reciprocating engine option has the lowest fullload heat rate, and is even more pronounced at part load operation. Two ways exist for the engine plant to achieve 50 percent plant load. First, half the plant can be operated at full load, which maintains the full load heat rate, depending on the auxiliary loads still running. Second, ramping all reciprocating engines down to 50 percent load simultaneously results in a net heat rate that’s still better than the frame GT full-load heat rate. This trend is illustrated in Figure 2, which shows the net heat rate curves at summer conditions.

Compared to most gas turbines, reciprocating engines can start up and ramp load more quickly, but the engine jacket temperature must be kept warm to accommodate start times under 10 minutes. Also, reciprocating engines are typically more tolerant of altitude and ambient temperature than gas turbines. Altitude and ambient temperature — with site conditions below 3,000 feet and 95°F — have minimal impact on the electrical output of reciprocating engines, though the efficiency may be slightly affected.

Modern reciprocating engines commonly exhibit availability factors of 95 percent or better when operated and maintained according to manufacturer recommendations. Because a given site may have multiple engines, maintenance outages can be staggered to avoid taking the entire plant offline. Similarly, an unplanned outage event for a single engine will not force the entire plant offline.

THE RISING NEED FOR FLEXIBLE GENERATION

The evolving makeup of the electricity market begins the case for flexible generation. In 1999, more than half of the energy in the U.S. was produced by coal-fired generators, according to the Energy Information Administration (EIA). In that same year, wind and solar energy accounted for approximately 0.1 percent (combined) of total generation.

Since then, environmental and economic drivers have continued to change the country’s energy supply composition. In 2015, coal energy fell to 33 percent of total generation, while the combined impact of wind and solar rose to 5.3 percent. This may not seem significant when considered nationally, but renewable integration is unevenly distributed in the U.S., so substantial impact areas exist where renewable penetration is high. For example, in 2015, wind accounted for more than 9 percent of installed capacity and 7 percent of generation in mulitple input, single output (MISO). In Electric Reliability Council of Texas (ERCOT), wind accounted for almost 12 percent of generation in 2015 and set a record for instantaneous penetration of 45 percent of demand in February 2016. However, in PJM in 2015, wind accounted for less than 4 percent of generation.

In the meantime, the makeup and behavior of energy consumers should also be considered. During the latter half of the 20th century, electricity consumption trends for industrial, commercial and residential customers steadily increased in parallel paths, as shown in Figure 3. However, electricity sales to industrial consumers flattened out in the 1990s while commercial and residential trends maintained their upward slopes. It is generally understood that industrial demand is a primary component of baseload electricity demand, while commercial and residential users usually set peak demand levels.

Therefore, the data presented in Figure 3 suggests that baseload demand has remained steady in recent years while peak demand continues to rise. Further, because of the significant annual expense that energy costs often represent for industrial consumers, they are more likely to have financial incentives to reduce energy consumption. Annual energy expenses for commercial and residential consumers are typically less significant in proportion. Except in areas where energy costs are significantly higher than the national average, there is less financial motivation for those consumers to change their consumption behaviors. This suggests that the trend in Figure 3 is likely to continue, meaning the delta between the daily peak demand and the baseload demand may grow.

fig3-chart

FIGURE 3: Retail Electricity Sales by Sector, 1949-2012. Source: EIA 2014 Annual Energy Outlook

THE INTEGRATION OF RENEWABLE ENERGY

Previously, increased peak demand was a relatively simple problem to solve, but it gets more complicated when considering the impact of renewable energy integration. Wind and solar sources are rapidly increasing their shares of annual energy production; however, the production timing can be a challenge for load serving entities (LSE) and ISOs. As intermittent resources, it can be difficult to match the load profile in areas with high renewable penetration. When the wind stops blowing, a reliable generator is needed with fast starting and ramping capabilities to fill that energy void quickly.

Generally, wind energy is more consistent at night than during the day and tends to be stronger during the spring and fall than the summer. Wind energy sources are also less likely to provide maximum benefit during summer days when peak demands are highest.

Solar generation is obviously at its best during summer days, helping to reduce peaks when the sun is shining. However, increased solar penetration creates an even greater need for flexibility among the generating fleet. Figure 4 demonstrates how significant implementation of solar resources can reshape a daily demand curve by displacing typical peaking, intermediate and baseload resources.

The blue line shows a demand curve with a consistent base load, intermediate plateau and late afternoon peak, based on a California ISO projection for a January 2020 day. The yellow and green lines show the impacts of solar and wind, respectively. Finally, the red line shows the resulting net load that must be met by dispatching the generating fleet. The red line, with two daily peaks, is typically labeled a “duck curve” because the daytime shape resembles the back of a duck. This curve demonstrates the importance of a fleet’s ability to ramp up and down quickly in reaction to the impact of solar generation.

fig4-chart

FIGURE 4: “Duck Curve” Example — Impact of Significant Solar Integration. Source: NERC and California ISO: 2013 Special Reliability Assessment: Maintaining Reliability While Integrating Variable Energy Resources-CAISO Approach

fig5

FIGURE 5: Expected annual O&M costs plus major maintenance costs.

THE EFFECT OF DISTRIBUTED ENERGY RESOURCE NEEDS

Localized grid factors are also driving the need for distributed energy resources, and reciprocating engines are competitive in that arena. Electric loads are typically connected at voltages under 230 kV, and extra-high voltage transmission systems often do not provide voltage support to lower levels. Renewable energy sources are also commonly connected under 230 kV, and often at distribution voltages. In areas where renewable sources are clustered and transmission constraints exist, flexible generating assets can help mitigate the impact of intermittent electricity resources.

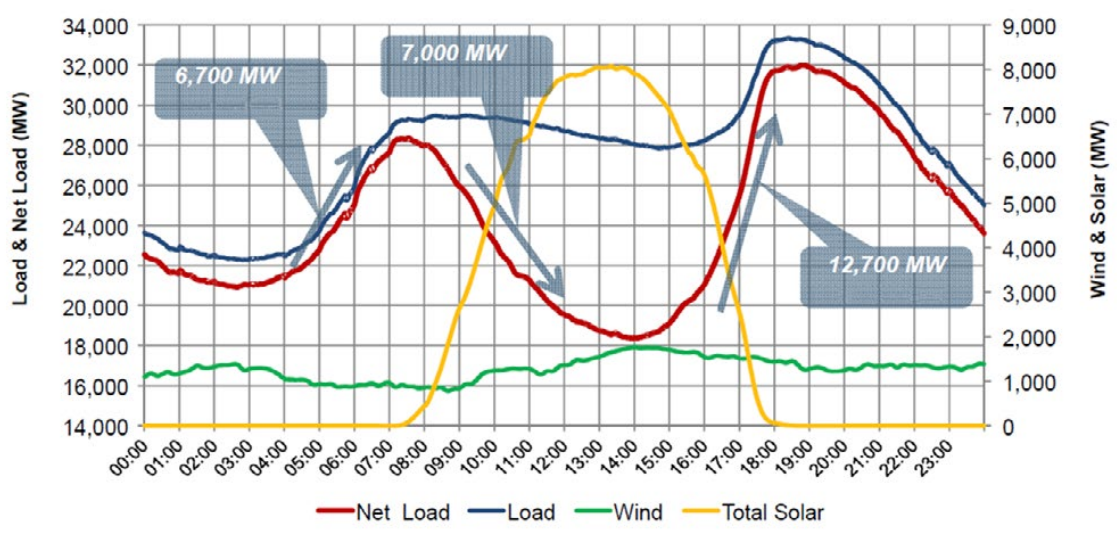
For example, wind farms are common in the middle of the country, in areas that also tend to be sparsely populated, so wind farms may be a significant portion of the local generation profile. LSEs need to balance those systems, but they likely have a much higher area control error (ACE) than an ISO, so flexible generation assets may be critical at lower voltages. In those areas, the fast start times and ramp rates of reciprocating engines, along with the ability to scale the installation linearly by reducing the number of engines at a given site, are well suited to “follow the wind,” maintaining desired output and frequency.

The technological benefits of reciprocating engines are evident for flexible peaking applications, but supply and demand drive the success of the plant, as demonstrated in an indicative economic analysis. For the example plant options introduced earlier, generation revenues were evaluated based on a production cost model (PROMOD IV) simulation using historical data from 2011 to 2014 in MISO, ERCOT and PJM. Essentially, the evaluation shows generation revenues according to the dispatch results during the study period.

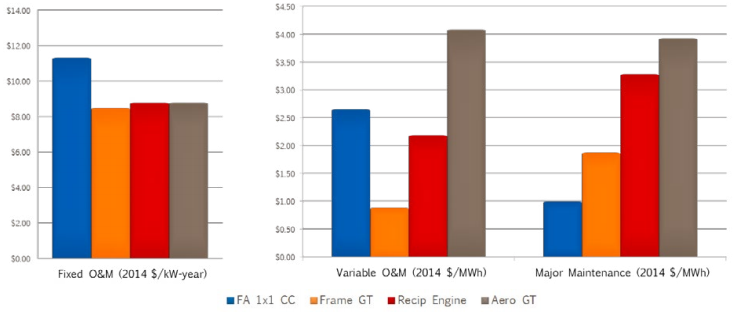
In Figure 5, the expected annual operating and maintenance (O&M) costs plus major maintenance costs are shown. Fuel is excluded from variable O&M. On a $/kW basis, there is little differentiation among fixed O&M costs for the peaking options.

Variable O&M rates are highest for the aeroderivative option, largely due to costs related to demineralized water consumption. Note that the aeroderivative model can be selected with dry combustors and fin fan cooling to minimize water consumption. That model would be expected to have variable O&M costs of approximately $1.50/MWh, but the output at summer conditions would be more than 10 percent less. The reciprocating engine plant requires very little water, measured in gallons per week, for cooling loop makeup. However, there is routine, minor maintenance on the engines plus SCR reagent and catalyst replacement considerations.

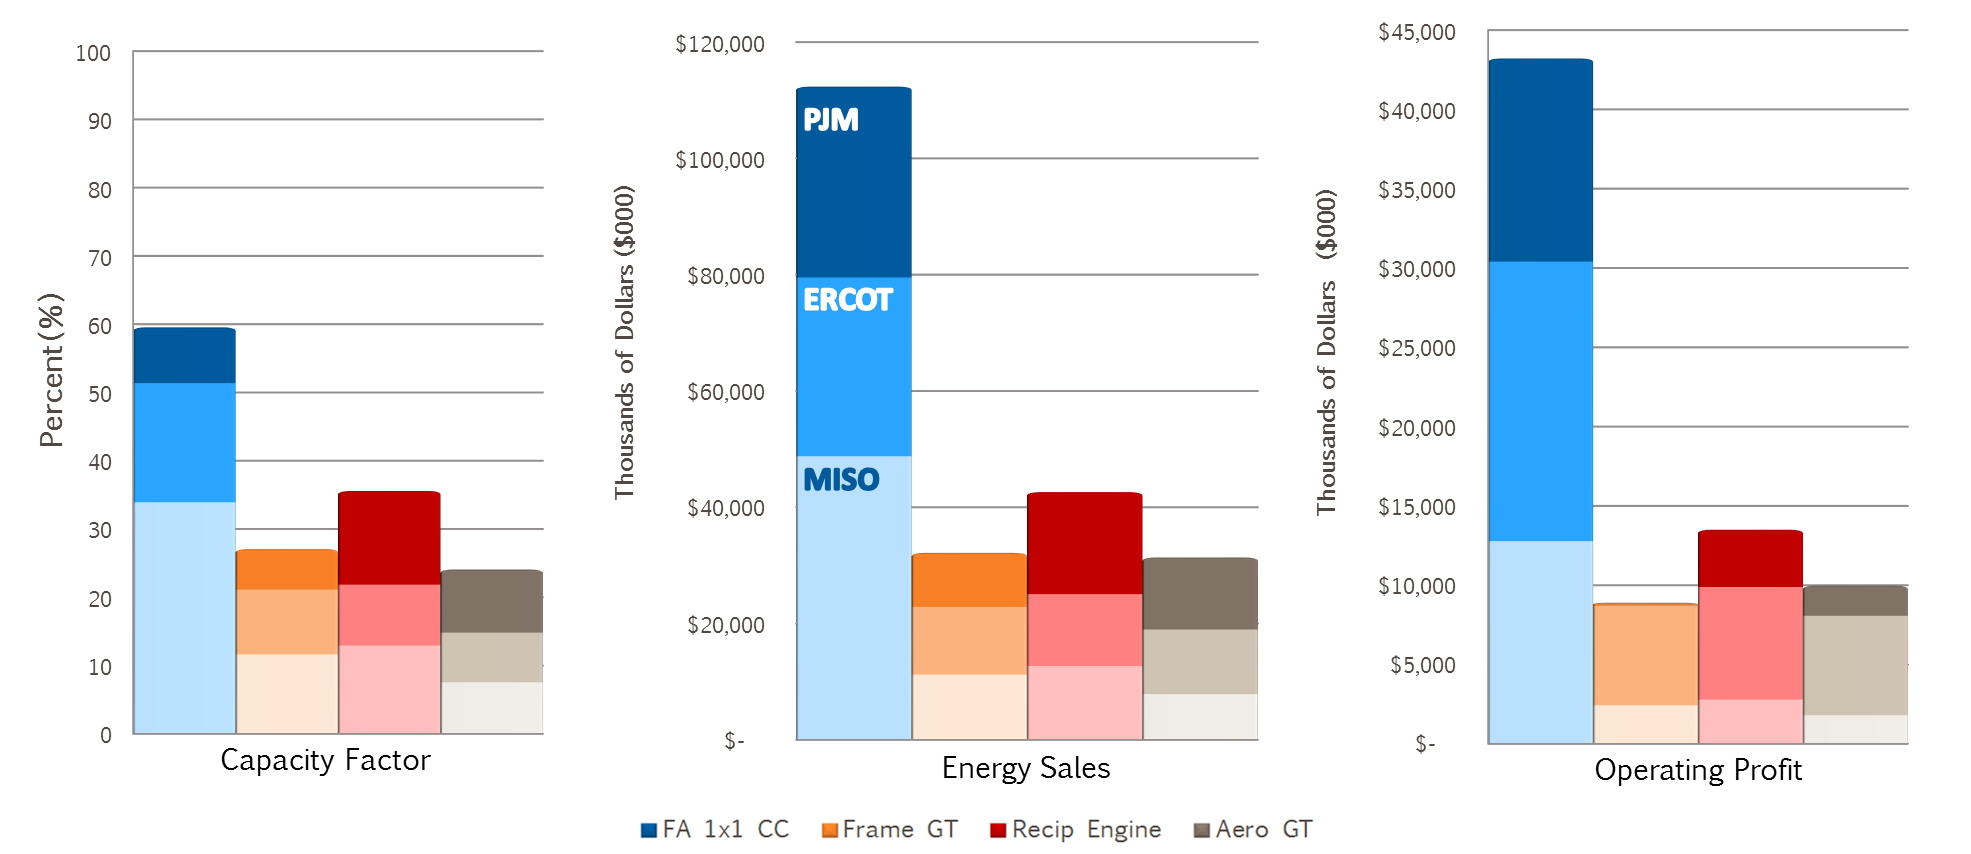
Figure 6 shows the comparative energy revenues based on the model results from three example ISOs broken out by color shading. The superior heat rate of the reciprocating engines allows for a higher capacity factor than the other peaking options, and therefore, better energy sales. The combined-cycle shows indicative comparison between peaking and intermediate dispatch applications. There are applications for intermediate dispatch of reciprocating engine plants where a combined-cycle may not be financially prudent. In direct competition at higher capacity applications, the combined-cycle will generate more revenue due to its superior heat rate.

image015

FIGURE 6: Energy Market Snapshot

CONCLUSION

Depending on the ISO, capacity markets and ancillary services markets (ASM) offer additional opportunities to generate revenue. Ancillary services commonly include frequency response, spinning reserves and non-spinning reserves. Frequency response is typically the most lucrative opportunity, and it also requires the most rapid response times. Reciprocating engines are well suited to compete among fossil fuel options for frequency response. Annual revenues from ASM represent a smaller piece of the total revenue pie, but they are a potential tiebreaker when choosing the most favorable generating option for an application.

Capital costs, of course, play a major role in an economic analysis because they are the hurdle to profitability. Of the peaking options shown, the F class GT has the lowest expected cost per kW output ($/kW), based on an engineer, procure, construct (EPC) contract methodology.

The EPC cost for a generic simple-cycle F class plant is approximately $550/kW, while a generic 220 MW reciprocating engine plant is approximately $950/kW. The capital cost difference is analogous to the energy density of the plants themselves. The frame GT generates more than 225 MW from a single machine, while the reciprocating engine plant requires 12 units to achieve a similar capacity. All this meaning, the engine plant requires more material to generate the same output, but the multi-shaft design allows for scalability and rightsized plant design in addition to the operational flexibility and superior heat rates outlined above. In any evaluation, it is important to consider the costs and benefits for the specific application.

Each opportunity and each ISO is unique. The market for reciprocating engines is rapidly expanding due to flexibility and performance benefits. Reciprocating engine designs allow for scalability and right-sized solutions, especially for applications in the 20-300 MW range. As the industry accelerates toward an even more dynamic and uncertain future, the market for proven, flexible generation will continue to grow.

PROJECT STATS

Client
Example Company

Location
Example location

Completion Date
Date

Lorem ipsum dolor sit amet, consectetur adipiscing elit. Nullam cursus lectus sed vestibulum malesuada. Vestibulum eget eros eleifend, imperdiet nisl et, hendrerit nisi. Sed sed ornare felis. Mauris posuere libero sit amet dui suscipit consequat. Duis elementum libero id pulvinar lacinia. Mauris nunc velit, imperdiet in urna et, pellentesque tempor ligula. Ut neque lorem, aliquam a lorem et, tristique eleifend dui. Curabitur massa quam, volutpat sed imperdiet vitae, elementum vel ligula. Ut purus felis, viverra vestibulum ultricies vel, blandit non nisl. Curabitur fringilla rhoncus nulla vel efficitur. Nulla in est gravida, vehicula sapien quis, consectetur est.

Proin scelerisque scelerisque fermentum. Aliquam fringilla purus arcu, facilisis lacinia neque bibendum eget. Aliquam faucibus tincidunt sapien et scelerisque. Proin tincidunt porttitor ipsum. Fusce vestibulum tincidunt eros, id tincidunt quam condimentum non. Phasellus ac nisi magna. Nullam pulvinar risus quis ligula finibus, nec gravida neque luctus.

Interested in learning more?

SEND US A NOTE