White Paper

Hitting the Bull's-Eye on Main Replacement Programs

As infrastructure upgrade requirements evolve and main replacement programs ramp up, the right tools to support these large, complex programs can help the natural gas industry succeed.


Olympic archery athletes repeatedly train for precision accuracy to be able to perform well in competition. But what if, after years of practice, the competition organizers announced a change in the distance of the target? Athletes who could almost hit a bull’s-eye blindfolded before must now adjust their approach for any chance of success.

The natural gas industry is dealing with just this type of situation, as the rules for infrastructure upgrades have changed.

For decades, utility companies replaced only a small fraction of their aging cast iron and bare steel gas mains. However, industry rules have been changed by state utility commissions and timelines for upgrades have drastically shortened. Suddenly, companies are expected to quickly ramp up main replacement programs (MRPs), and this moving target is a challenge to hit.


Read The White Paper

Olympic archery athletes repeatedly train for precision accuracy to be able to perform well in competition. But what if, after years of practice, the competition organizers announced a change in the distance of the target? Athletes who could almost hit a bull’s-eye blindfolded before must now adjust their approach for any chance of success.

The natural gas industry is dealing with just this type of situation, as the rules for infrastructure upgrades have changed.

For decades, utility companies replaced only a small fraction of their aging cast iron and bare steel gas mains. However, industry rules have been changed by state utility commissions and timelines for upgrades have drastically shortened. Suddenly, companies are expected to quickly ramp up main replacement programs (MRPs), and this moving target is a challenge to hit.

Industry Drivers

After decades of the status quo, several major trends are driving a change in the industry:

  • An extended period of low natural gas commodity prices has allowed more money to be spent on infrastructure modernization, without causing excessive burden on ratepayers.
  • An intense focus on safety and awareness of aging pipeline infrastructure is driving accelerated replacement of leak-prone pipes.
  • Gas pipeline incidents are resulting in calls for pipeline replacement from the Department of Transportation.
  • Approximately 50 percent of methane emissions are from natural gas infrastructure.

The drivers of accelerated gas infrastructure modernization are also causing increased spend on upgrades in electric, water, sewer and other modernization programs.

These trends are also affecting other industries. For electric utilities, the low cost of gas is helping to keep electric distribution costs down, while also accelerating infrastructure modernization programs. Safety issues, such as the lead exposure that made headlines in Flint, Michigan, are driving increased spending on water infrastructure and pipe replacement programs. Sewer, road and other big infrastructure systems are also undergoing major shifts in annual capital spend programs.

Tools to Hit the Target

Because MRP programs can be large and complex, and with many stakeholders, it is imperative that systems and processes are properly set up to support the work. Gas companies have been structured operationally to meet the prior, lower production levels.

New MRP demands require a growing workforce and accelerated production targets, filtering more moving parts into the legacy method of performing the work. To adequately prepare and help organizations meet new MRP goals successfully, start with the right tools.

Benchmarking

During any initiative of this scale, it’s important to understand how others in the industry are operating and performing. Getting underway in the development phase of an accelerated MRP program is an ideal time to undertake benchmarking — using current industry standards and best practices to help shape planning and gauge program effectiveness.

Common practice for companies and utilities is to benchmark against industry peers and share information at regular intervals. During a program’s development phase, plans and data are compared against multiple companies, regions and potentially even other industries with varying project delivery methods that shape the operation. Every organization is structured differently and has different needs or limitations that shape an operation.

To prepare to benchmark, first consider the question: “Is our company staffed properly to undertake this new program or project?” While some companies are organized to handle new, large programs from start to finish, others use a dedicated team that does not fluctuate as much with the given workload. If using an outside contractor to manage parts of a program, plan on bringing this partner on early in the process. Partnering with an outside contractor at the beginning saves time in the onboarding process, defines the role, and is less risky for the program and company.

Project Management

It is essential to properly build the team and system that will handle the work. Using a project management office (PMO), or instituting formal program management, will define and implement systems that can help standardize processes to deliver consistency and control. Multiple departments working on the same effort should have a reporting structure in place built to reach elevated yearly goals and demands.

Using a PMO can streamline many of the processes and decisions that need to be made across a wide range of work and departments. Key advantages include:

  • Efficient use of resources, both internal and external.
  • Increased visibility on upcoming work and who will be performing this work.
  • More accurate forecasting by seeing the big picture of work performed, identifying trends and more defined spend curves.
  • Project savings through more refined bidding and reduced potential for change orders.

A simple workflow diagram, as shown in Figure 1, illustrates how an MRP flows from initial planning through closeout while clearly defining roles, responsibilities and systems.


Figure 1: Start by defining the project management life cycle for a typical MRP project.

CLICK TO ENLARGE

Figure 2: Simplified schedule drives accuracy on key pre- and post-construction activities.

CLICK TO ENLARGE

Project Controls

Once program management is in place and departments — from engineering, construction and asset management to project management, restoration and more — are brought into the process, it is time to focus attention on creating a robust project controls system.

Strong project and program management and project controls will give command over the schedule, budget, scope and risk. Project controls provide for effective resource management, project savings, accurate forecasts and efficient handoffs between departments.

Project controls offer the ability to manage MRP at portfolio, program and project levels. Gas utilities often have dozens of project-level MRP efforts at any time, whether covering entire neighborhoods or 100-foot sections in a specific street. These project-level efforts are part of different program-level activities and tariff structures. Together, all projects make up a utility’s portfolio of gas work.

Forecasting

Accurately forecasting when project work will be completed, and when money will be spent, is one of the most important elements of managing MRP. Strong cash flow and a positive relationship with the state regulatory body depend on an ability to complete the amount of MRP work defined, at the committed cost.

Using scheduling software to establish a good control schedule means the full project life cycle is planned and tracked against a baseline. Schedules, as shown in Figure 2, are essential for getting a project to construction on the originally planned date.

Bottom-up/top-down forecasting is an effective way to work with contractors, construction managers and program managers to forecast work on a weekly basis for every project. This forecasting method happens at the project and activity level (e.g., service insertion, meter move) and predicts both production and cost across the project life cycle. Forecasts are then rolled up to the program, then portfolio, levels. These steps create the bottom-up perspective of the forecast. See Figure 3 for an illustration of the portfolio, program and project levels.

Figure 3: Develop a bottom-up/top-down forecasting system to drive forecast accuracy across your entire portfolio.

CLICK TO ENLARGE

Figure 4: Main installation projections and actuals, representing a single contractor’s workload in feet of main installed. *Colors representative of unique projects

CLICK TO ENLARGE

With detailed forecasts created for each project, activities can be reviewed and adjusted at the program and portfolio levels, making up the top-down assessment of the forecast. The top-down view of the MRP allows several advantages and project control benefits, including:

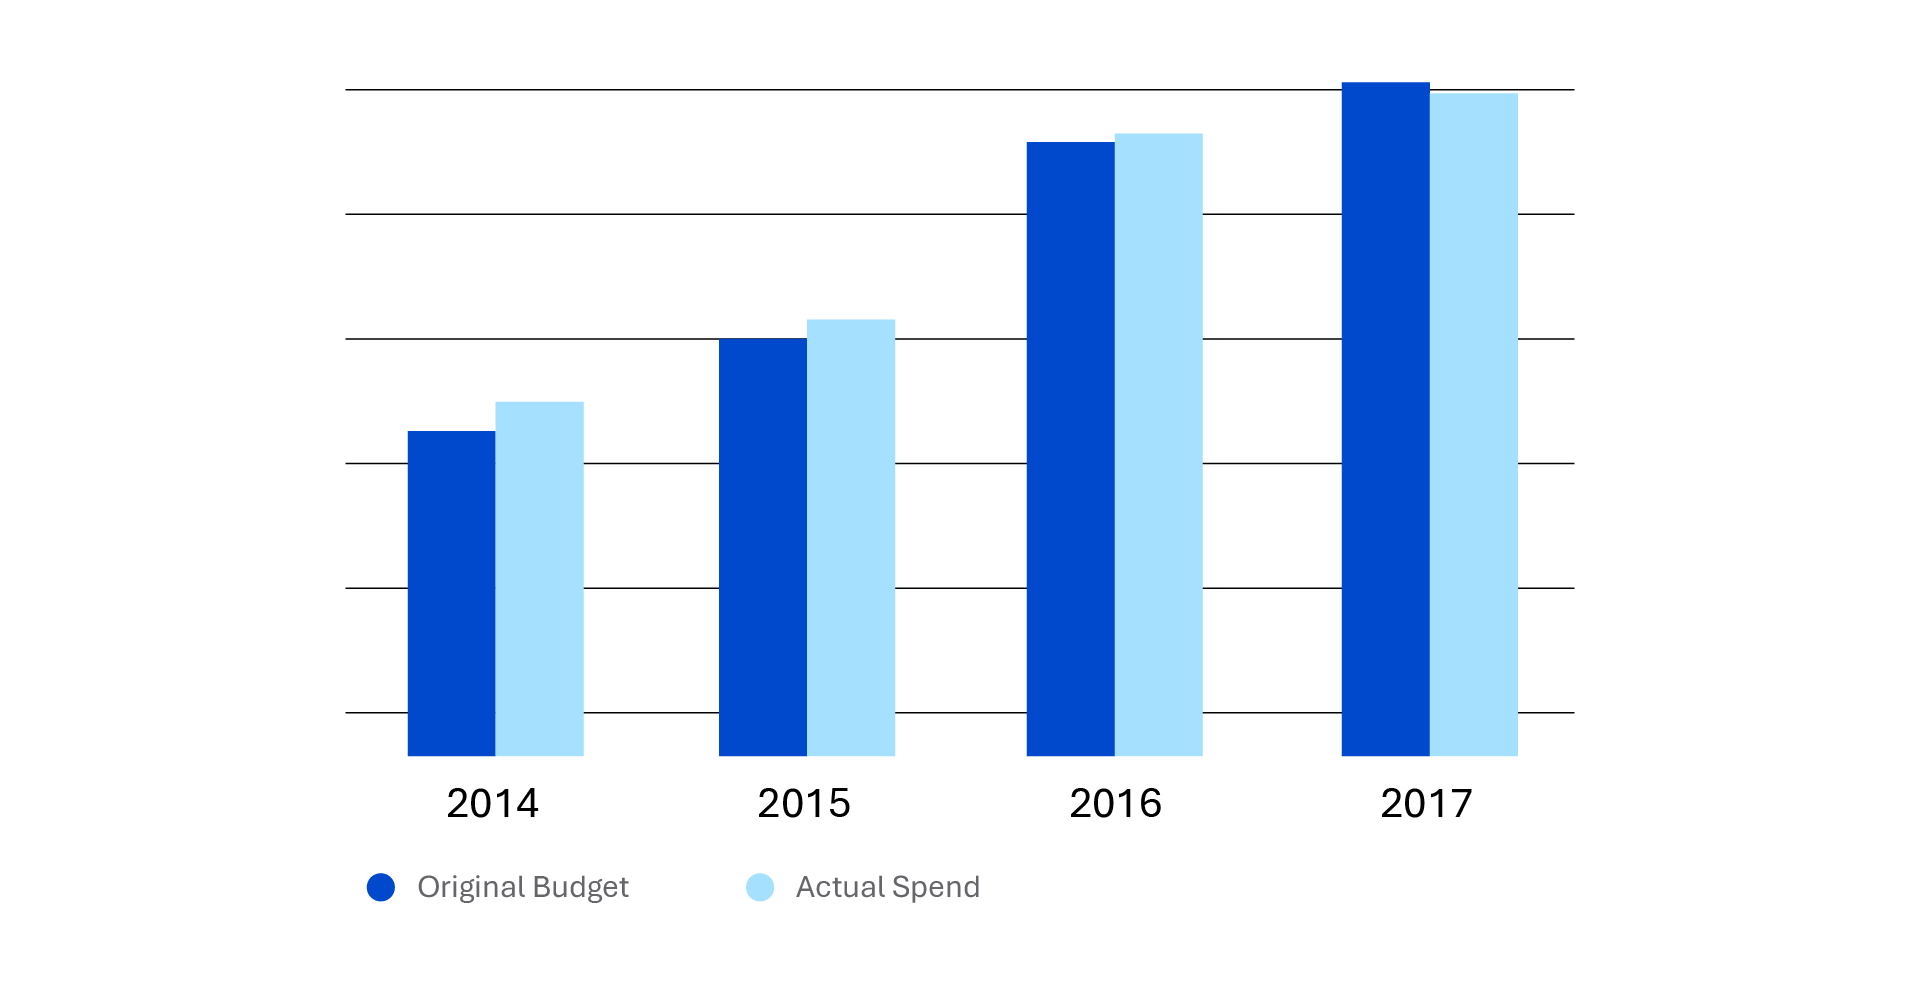
  • Making sure programs are meeting scope and spend targets, and providing an at-a-glance understanding of activity, schedule and budget for each program and portfolio.
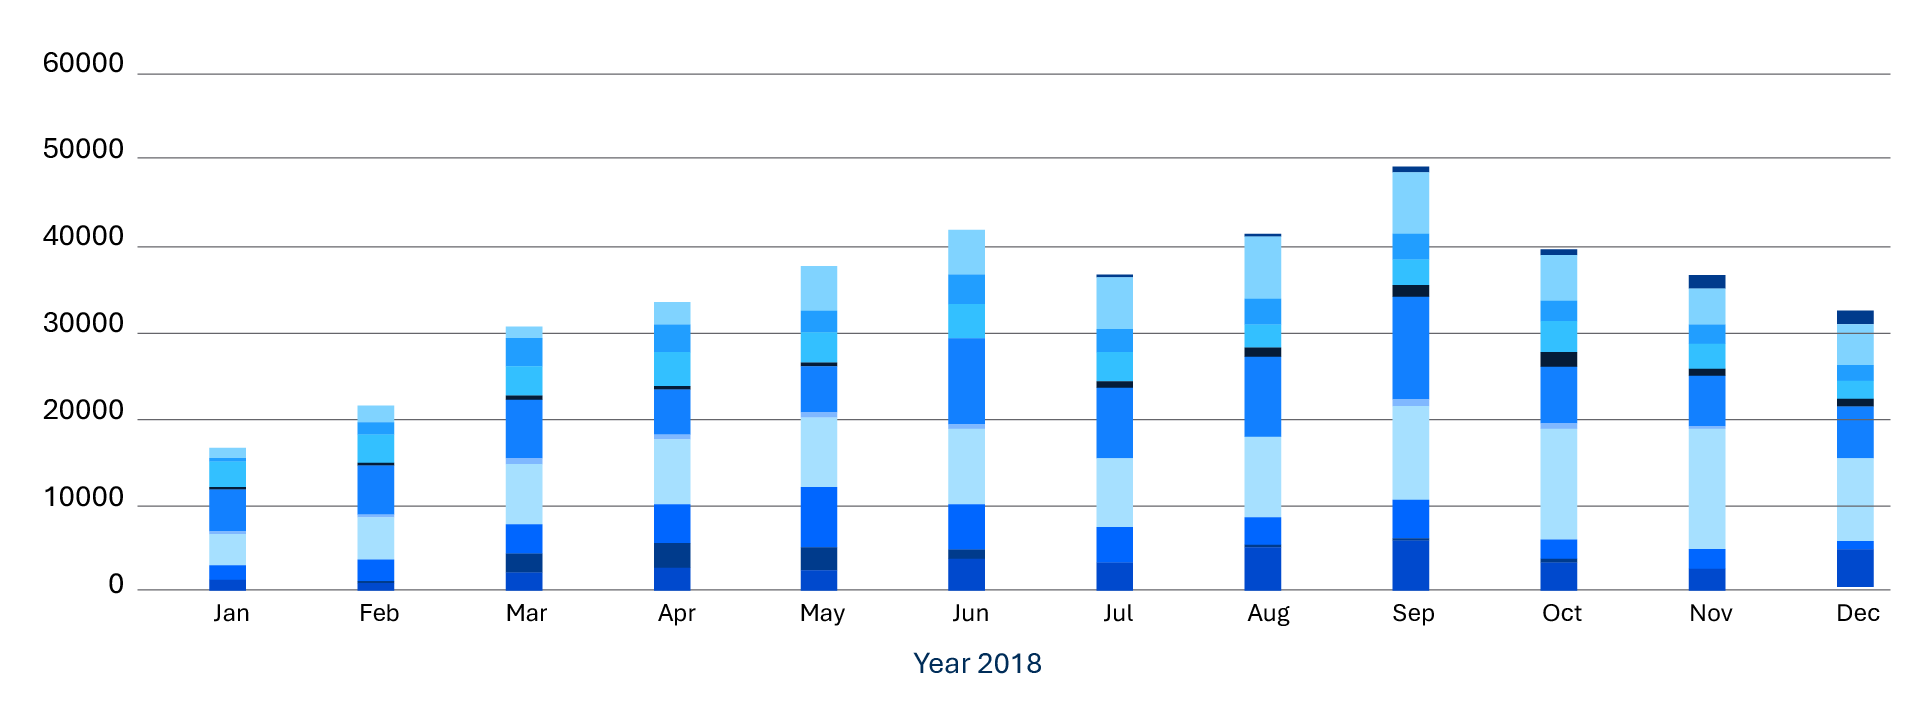
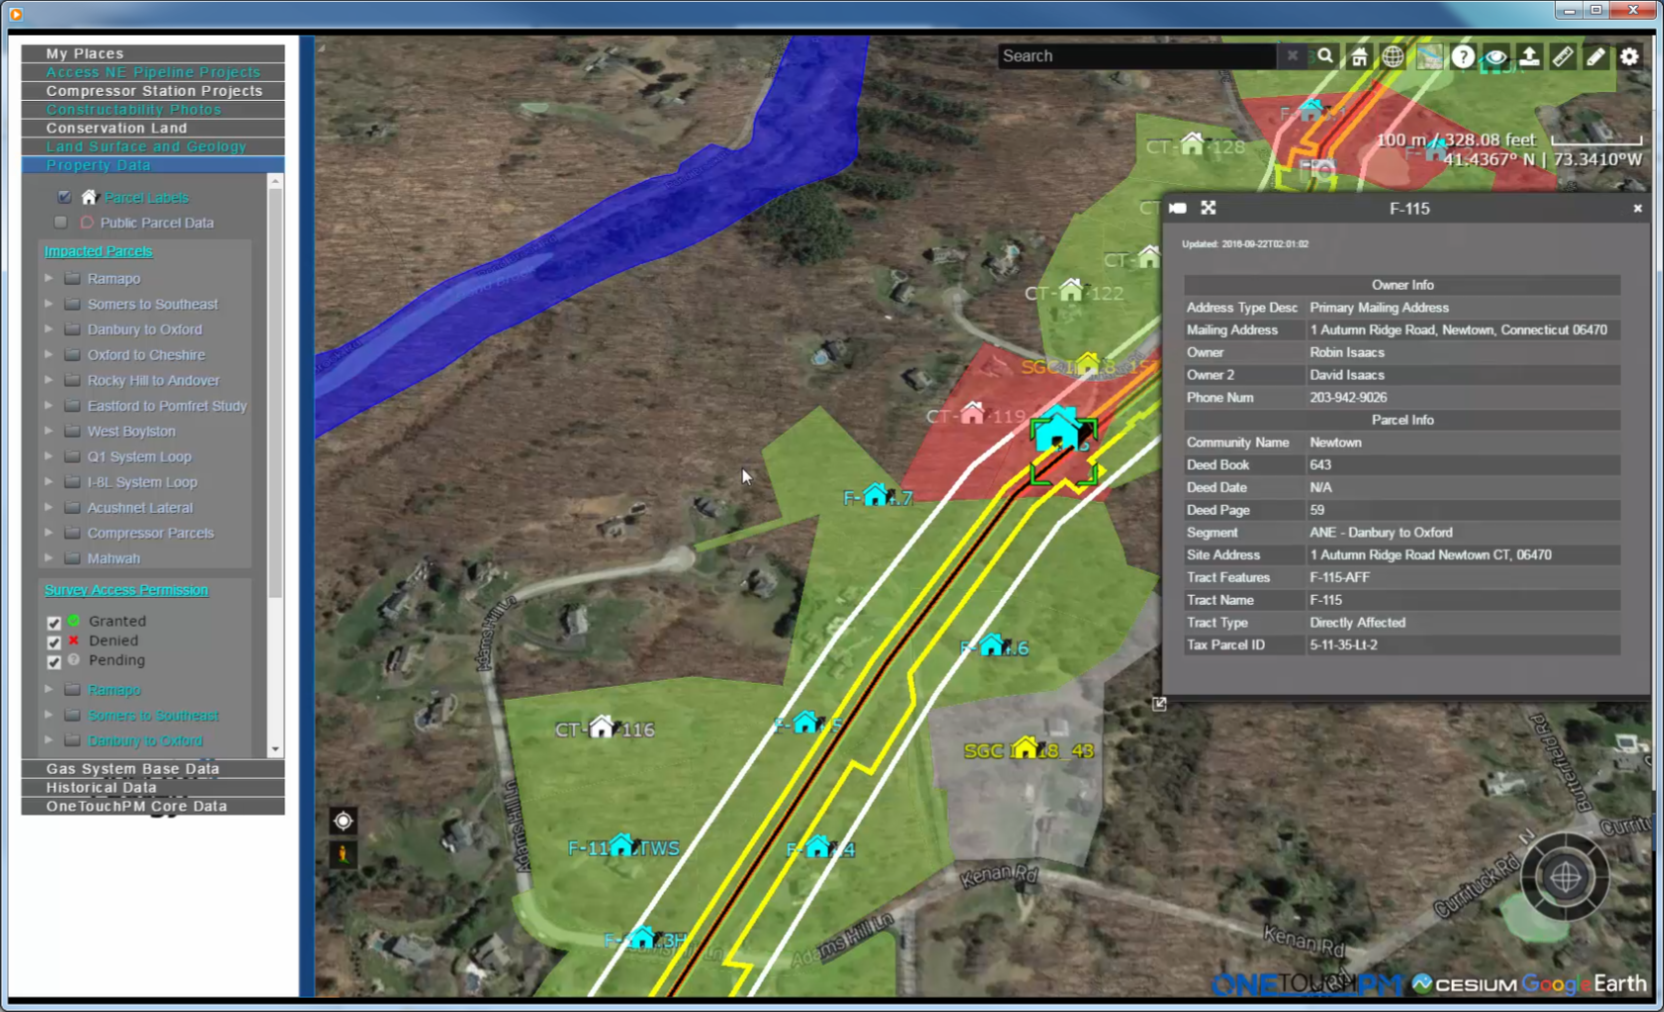
  • Evaluating construction and engineering resources at the portfolio level. Resources are often shared across many projects, making it critical to evaluate, for example, a construction contractor at the portfolio level. The resource stack chart in Figure 4 evaluates each contractor’s capacity by spend, main installation, and service replacement to determine which contractors have the capacity to take on additional work and which are overallocated.
  • Accounting realistically for high-level productivity and spend capacity. With a higher-level view, and without adjusting dozens of individual forecasts, the top-down forecasting view tempers overly optimistic contractor forecasts to accommodate everyday delays, inspection issues and equipment breakdowns.

An iterative estimating process improves the accuracy of cash flow forecasts throughout the life cycle of a project. As you move from the early planning stages of a project and get closer to construction, your estimate becomes increasingly accurate.

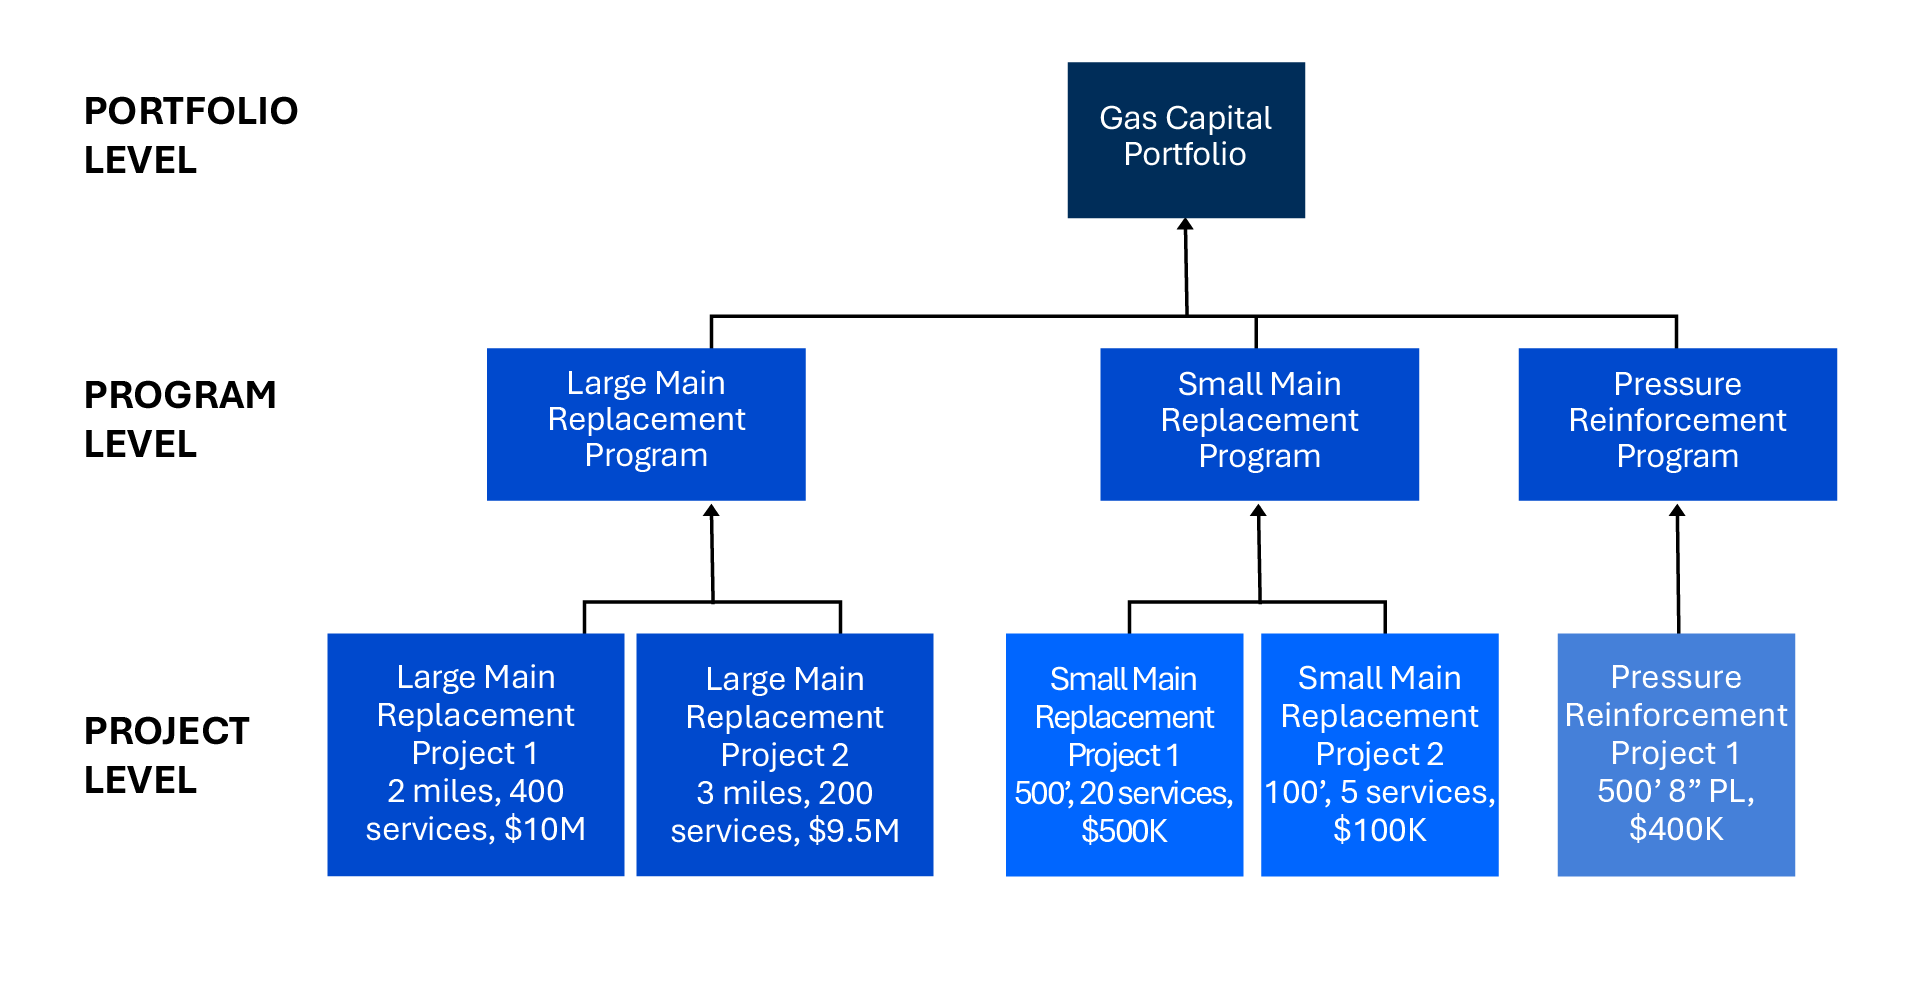
For example, when an MRP is being developed, perhaps still in the early planning stage, it might be reasonable to estimate that a project will require roughly 6,000 feet of an 8- or 6-inch plastic main with about 100 to 110 services, half of which are anticipated to be transfers and half to be inserts. Based on historical unit costs, this is enough information for a planning-level estimate.

As a project moves through planning and design, and a firm understanding of scope becomes apparent, estimates can be refined with specific unit quantities, still using historical unit costs. Finally, once a contractor has been selected, estimates can be further refined with actual unit costs — or lump sum — and an updated schedule for production. While these project controls techniques can be applied to projects large or small, increased effectiveness has been found to be associated with bundling main replacement work into neighborhood projects of at least 1 mile. Conducting work in a bundle, rather than in multiple small projects of several hundred feet each, has several benefits:

  • Work can be efficiently handled as a distinct project, with a project manager and its own schedule.
  • Work is simplified for the contractor — less mobilization cost, less time lost scheduling service replacements and potentially fewer tie-in pits.
  • Pressure upgrades are more feasible in some neighborhoods.

The Right Bow for the Job

With so many tools available for project controls systems, making the right choice can be a bit like selecting a bow for an archery event — there may not be one answer to fit every person. A tailored selection of tools should be applied to fit individual utilities and programs. For example, more complex projects or programs with enterprise-level reporting and tracking requirements would typically call for a solution such as Oracle’s Primavera 6 as the scheduling tools, whereas simpler, oneoff projects might be suitable for MS Project. Likewise, for smaller portfolios, Excel may be sufficient as a project tracking system, but for larger portfolios with more intensive project controls and data analytics needs, tools like Unifier and Microsoft Power BI should be applied.

For utilities and programs with a geographic information system (GIS), a platform that allows project management as shown in Figure 5, controls and operations to integrate within one geospatial tool would be valuable. A tool such as OneTouchPM® from Burns & McDonnell is one way to help engineers, PMs, inspectors, contractors and managers visualize and plan projects, and track progress as they go.

Figure 5: GIS tools can integrate your project and program management systemsonto a geospatial platform.

CLICK TO ENLARGE

Challenges Along the Way

En route to achieving success, there are likely to be several bumps in the road. For MRP, organizational flexibility and the ability to facilitate change management are key as new systems, controls and processes are introduced.

Many internal stakeholders will have to learn a new way to perform their duties and some might resist taking on a new system or program management feature. External stakeholders and contractors will also need to be on board to succeed. Having field contractors tied into management or control systems helps determine the amount of work performed and also assists in reporting and making data available for the rest of the team.

Permitting is another critical hurdle for any project or program. Many of the required permits are very routine and do not vary greatly from one job to the next. On occasion, however, there is an abnormal crossing, whether it be a railroad, bridge or environmentally sensitive area, that can cause a delay in getting to construction. For these instances, it’s important to get ahead of any special permitting by applying early and tracking permit status in a schedule. That way the project is not held up, which could impact cost and productivity.

Another internal challenge comes in putting together a realistic forecast. At times, contractors and other team members do not want to disappoint or do not anticipate any complications. Conversely, it is possible that team members default to a more conservative view, which leaves cost and production projections falling short.

Figure 6: MRP budget vs actual budget. BGE has been successful in significantly ramping up MRP volume year-over-year while increasing accuracy in spend forecasting at the same time.

CLICK TO ENLARGE

Through good planning and management, the unique dynamics of each MRP can be understood and all available tools used to control the process. With. benchmarking, project management and controls, regular tracking and open communications, MRPs can find the most accurate trajectory for the arrow to reach the bull’s-eye.

Figure 7: Main installation cost/foot showing an 8.6 percent reduction

CLICK TO ENLARGE


Authors

Jonathan Kadishson, PE, LEED AP

Department Manager

Paul Sylvester, PE, PMP

Construction Project Manager