Driving the Design of ASRS Solutions With Data

Data is vital when considering a warehouse automation project, but it can be unclear how data drives the design of automated storage and retrieval systems. Learn how historical data plays a crucial role in a cost-effective design.

Read The White Paper

Big Data, the internet of things, Factory 4.0. There’s no shortage of jargon relating to current data trends. Essentially, though, all of these terms refer to the use of data to make better objective decisions.

Today, data-driven decision-making is used in industries ranging from retail and banking to healthcare and manufacturing. While it is often most closely associated with increasing sales and revenue, it is equally relevant for the design of automated systems in both manufacturing facilities and warehouses. Specifically, historical and operational data should drive the design of every automated storage and retrieval system (ASRS).

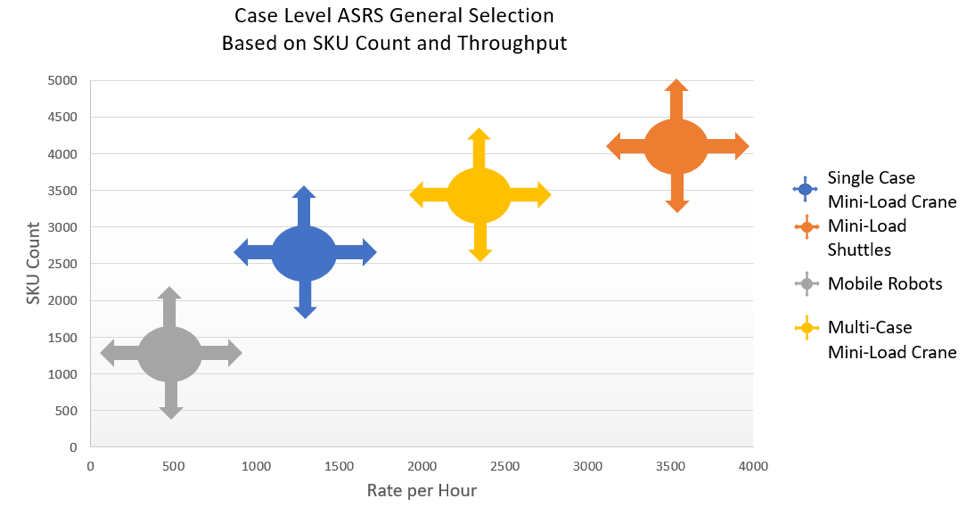
On warehouse automation projects, “We need data” is a common refrain. But it is less clear how data actually leads the design of the system. This paper will provide a general overview of how data drives ASRS design, although each technology supplier or integrator will use its own design methodologies and conduct a deeper assessment into the variables that affect the successful design of individual systems.

TERMS YOU SHOULD KNOW

First, clarity of terms is needed. The term ASRS is often used to refer to automated warehouses, because products are stored or retrieved automatically from locations within the building. The term also can be used to describe the actual robots that retrieve products from racks. In this paper, ASRS refers to the entire warehouse system.

ASRS suppliers commonly talk about the design of the system and sizing of the system. Design of the system refers to the process of selecting the most appropriate technology, such as a unit load (UL) crane, robotic layer picker or automated guided vehicle (AGV). After the technology has been identified, the quantity of each of the technology products has to be determined. This is known as sizing the system. Both design and sizing are guided by data.

A YEAR’S WORTH OF DATA

Most businesses have cyclical demand, meaning they don’t fulfill orders consistently throughout the year. For example, hot beverage suppliers experience high demand during the winter, while those who sell cold beverages have high demand in the summer. Many retailers have high demand during holidays, while other businesses might be dependent on promotions driven by marketing.

Successful ASRS design depends on a thorough understanding of rate requirements, inventory, stock keeping unit (SKU) profiles and space requirements throughout this cyclical pattern. Accordingly, at least one full year of data is essential to the design of the ASRS.

DESIGN OF THE SYSTEM

Data relating to an order volume profile plays a key role in determining the technology needed to optimize the output of the system. Orders can be fulfilled at different picking units, such as a full pallet, a layer, a case or even a single unit. Understanding the volume of each of the units picked throughout the year is critical to selecting the right technology. The data also must be broken down to the rate required per hour, because this is how equipment is specified.

ANALYZING HISTORICAL FULFILLMENT VOLUME

The initial step in designing the system is analyzing historical fulfillment data. Decisions regarding what to automate should be driven mainly by savings in operating cost, improved efficiency and reduction of physically demanding tasks performed by operators. Other internal factors also may be considered. Figure 1 shows the fulfillment volume by picking unit for a warehouse that fills orders in pallets (or unit loads), layers and cases.

Graph 1 without title

FIGURE 1: Fulfillment volume by picking unit. This sample data indicates the need for an ASRS solution that prioritizes the picking of pallets.

Over the course of the year, about 65 percent of the total volume was picked as pallets. About 30 percent was picked as layers, and the remainder was picked as cases. Therefore, the solution for this warehouse should prioritize automating the picking of pallets because it makes up the highest operating cost.

This data profile is typical for a warehouse attached to a manufacturing facility. By comparison, the data for a retailer distributing to smaller stores or distribution centers (DCs) would likely be reversed. In that situation, cases would make up approximately 65 percent of the total picking volume, and the solution would need to be optimized for picking cases.

SIZING OF THE SYSTEM

Next, you’ll need to evaluate the volume for each of these package types to determine if automation is the right solution, and if so, which technology is most appropriate. To accomplish this, the volume of product shipped must be broken down to a daily rate and then an hourly rate, which is called the throughput of the system. There are various approaches to calculating throughput.

One method uses the average volume per day. This is a cost-effective approach, but when there are spikes in demand, a system sized on the average won’t be able to keep up. Some owners might prefer this method to reduce the initial capital investment. Typically, they would plan to supplement the system with manual labor during periods of peak demand.

Another method is to size based on the peak daily volume. In this case, you know the system will be able to keep up with peak demand, but it will be more expensive to build and will be underutilized when not operating at peak levels. Owners prefer this approach when the return on investment (ROI) for even this larger investment is within their payback policy.

A third option is to try to balance the peaks and valleys to cover the highest percentile of the volume seen throughout the year. Budget constraints, space availability and ROI goals also will influence what percentile will be used.

Graph 2 without title

FIGURE 2: Full pallet orders; 3000 pallets per day represents the 90th percentile of daily volume at this distribution center.

A COMMON APPROACH: THE 90TH PERCENTILE

In the material handling industry, it is common to size the ASRS solution to the 90th percentile of the daily volume. A manual process can be set up as a contingency for peaks, or the system simply can be run longer.

Figure 2 represents an example of an analysis done for pallet orders for a distribution center. It depicts the volume of daily pallet orders across seasons. Note that although daily volume is low at the beginning of the year, demand ramps up as the year progresses.

In this example, sizing the system to the 90th percentile would mean using the rate of 3,000 pallets per day. This volume would then be divided by the number of hours of operation per day. There is no hard rule on the number of hours to use in this calculation, since many variables specific to each application must be considered. System throughput requirements need to account for inbound material into the system (replenishment of the system), shipping and production schedules, and order fulfillment demand schedules.

Equipment maintenance and peak volume also should be considered. While the best ROI for the system is achieved when the equipment runs 24 hours per day, it is better to size the system based on 20 or 21 hours per day to allow for regular maintenance and additional capacity. In this instance, if the daily rate of 3,000 pallets per day were divided by 21 operating hours per day, the system throughput required would be 143 pallets per hour.

TECHNOLOGY SELECTION FOR PALLET PICKING

Once you know the hourly throughput requirements, you can select the technology that best fits the application. Figure 3 shows general guidelines for the selection of different types of pallet ASRS based on throughput and number of SKUs.

A system that handles fewer than 200 SKUs usually requires one type of crane technology, while a system that handles more than 1,000 SKUs requires another. Each circle shows arrows pointing outward, because no absolute number determines the technology used.

Once the ASRS type is selected, the “size” of the system can be determined by dividing the throughput of one device by the total rate required. In the previous example, the SKU count is around 600. Therefore, a UL crane is the best technology choice. The typical dual cycle rate for a UL ASRS is around 50 pallets per hour. Because system throughput is 143 pallets per hour, at least three cranes would be required to meet the system throughput.

Keep in mind that the system should never be designed at its peak rate. Instead, it should be designed for between 85 percent and 90 percent utilization to make sure the system has capacity for peaks and catchup in case of downtime.

blue-box

Picture3

FIGURE 3: Unit load ASRS general selection based on SKU count and throughput. System throughput and SKU count are important considerations when selecting pallet-picking technology.

It’s important to note that this is a simplified example. In a real sizing exercise, other variables would be taken into account, such as space availability, inventory requirements and specifics related to the product being handled.

TECHNOLOGY SELECTION FOR CASE LEVEL PICKING

The data analysis used to select the technology for picking single cases is very similar to that used for picking pallets. Several different types of storage and retrieval technology can be used, and Figure 4 shows which are most appropriate for various rate requirements and SKU counts.

Many other variables also must be considered when selecting technology for picking cases, boxes or totes. These include the footprint available for the system, building height, type of product and SKU velocity profile.

As in a manual picking operation, the lines per order are vital when sizing a case level picking system. Lines per order equates to the cycles the automation must conduct per order. Some manufacturers use sophisticated picking algorithms that can optimize the motions the equipment must complete. For example, some software can create waves of similar orders that require the same SKU. This reduces the number of cycles the equipment must perform; however, the effectiveness of these algorithms is affected by many factors, including order picking and sequencing requirements, order look-ahead time and truck stop delivery schedules. Consequently, each equipment manufacturer will have different throughput.

Picture4

FIGURE 4: Case level ASRS general selection based on SKU count and throughput. System throughput and SKU count are critical when selecting case-picking technology.

SKU velocity also plays an important role in sizing a case picking system. Very high movers or very slow movers might be better off outside of the ASRS. There might be more cost effective methods for picking these SKUs.

Don’t forget to account for the return of totes into the ASRS, as this is another significant consideration. If the volume of case picking is greater than 150 picks per hour, automated case picking might be an option. If the average SKU quantity is greater than a layer quantity, then the system is a good candidate for robotic layer picking.

A robotic layer picker can average around 150 layer picks per hour, so the case-per-hour throughput can be relatively high, depending on the quantity of cases per layer. For example, if the average number of cases per layer is 10, then the robotic layer picker would average 1,500 cases per hour.

CONCLUSION

When designing an ASRS, historical and operational data should be used to determine the type of technology and the correct sizing of the system. Collecting and analyzing a full year’s worth of data allows you to account for seasonal changes in order volume and implement the most cost-effective solution that will meet your needs.

Many additional factors, including ROI objectives, budget constraints and the space available, also influence the final decision of what technology to use. If you do not have engineering resources within your organization, a turnkey system supplier can help you evaluate your data and process to select the best ASRS solution for your requirements.

PROJECT STATS

Client
Example Company

Location
Example location

Completion Date
Date

Lorem ipsum dolor sit amet, consectetur adipiscing elit. Nullam cursus lectus sed vestibulum malesuada. Vestibulum eget eros eleifend, imperdiet nisl et, hendrerit nisi. Sed sed ornare felis. Mauris posuere libero sit amet dui suscipit consequat. Duis elementum libero id pulvinar lacinia. Mauris nunc velit, imperdiet in urna et, pellentesque tempor ligula. Ut neque lorem, aliquam a lorem et, tristique eleifend dui. Curabitur massa quam, volutpat sed imperdiet vitae, elementum vel ligula. Ut purus felis, viverra vestibulum ultricies vel, blandit non nisl. Curabitur fringilla rhoncus nulla vel efficitur. Nulla in est gravida, vehicula sapien quis, consectetur est.

Proin scelerisque scelerisque fermentum. Aliquam fringilla purus arcu, facilisis lacinia neque bibendum eget. Aliquam faucibus tincidunt sapien et scelerisque. Proin tincidunt porttitor ipsum. Fusce vestibulum tincidunt eros, id tincidunt quam condimentum non. Phasellus ac nisi magna. Nullam pulvinar risus quis ligula finibus, nec gravida neque luctus.

Interested in learning more?

SEND US A NOTE