
How and where we grow our food is changing radically. With the rise of the farm-to-table movement as well as an increase in the number of food recalls for various problems, more consumers are turning to local solutions for their food. These are changes that will have an impact on electricity use and grid design soon. Add cannabis legalization into the equation, and the country is now facing an almost nationwide agricultural transformation.
Agriculture in developed and some developing nations has been facing crucial change over the last decade. In traditional U.S. agriculture, produce travels an average of 1,400 miles from remote locations to urban centers. In Europe the distance is shorter but still significant. Shipping 1 ton of produce generates 0.25 ton of carbon dioxide (CO2) alone. Traditionally, seasons and weather have dictated the when, where and what of planting. Areas became known for what they grow. For instance, California is known for winter strawberries, and Mexico is known for winter salad ingredients. Greenhouses were introduced to the food production process to bypass some of the adverse seasonal effects, while still allowing for the use of sunlight.
The latest agricultural revolution has two main drivers: indoor agriculture and the state legalization of cannabis. This agriculture revolution will change what is consumed, how fresh it is, and how much energy is required for production. Electric utilities nationwide have already started investigating some of the effects of these changes to the power grid. An effort to continue quantifying these changes is needed both in the short and long term to help utilities better prepare for this load increase.
Read The White Paper
How and where we grow our food is changing radically. With the rise of the farm-to-table movement as well as an increase in the number of food recalls for various problems, more consumers are turning to local solutions for their food. These are changes that will have an impact on electricity use and grid design soon. Add cannabis legalization into the equation, and the country is now facing an almost nationwide agricultural transformation.
Agriculture in developed and some developing nations has been facing crucial change over the last decade. In traditional U.S. agriculture, produce travels an average of 1,400 miles from remote locations to urban centers. In Europe the distance is shorter but still significant. Shipping 1 ton of produce generates 0.25 ton of carbon dioxide (CO2) alone. Traditionally, seasons and weather have dictated the when, where and what of planting. Areas became known for what they grow. For instance, California is known for winter strawberries, and Mexico is known for winter salad ingredients. Greenhouses were introduced to the food production process to bypass some of the adverse seasonal effects, while still allowing for the use of sunlight.
The latest agricultural revolution has two main drivers: indoor agriculture and the state legalization of cannabis. This agriculture revolution will change what is consumed, how fresh it is, and how much energy is required for production. Electric utilities nationwide have already started investigating some of the effects of these changes to the power grid. An effort to continue quantifying these changes is needed both in the short and long term to help utilities better prepare for this load increase.
The Cost of Purchased Energy
A key reason that modern indoor plant factories for either produce or cannabis haven’t yet made traditional greenhouses completely obsolete is the cost of purchased energy. A study comparing plant factories to greenhouses showed that for three locations studied, plant factories outperformed greenhouses in water use, CO2 absorption and land use productivity, and total (purchased plus non-purchased) energy efficiency.
Even the most efficient greenhouse location studied — in Sweden, with artificial illumination — was outperformed by plant factories in terms of dry weight energy efficiency (472 kWh/kg versus 392 kWh/kg of dry weight produce). When purchased energy was compared, however, greenhouses excelled, with a requirement between 70-211 kWh/kg versus a plant factory requirement of 247 kWh/kg. The greenhouse requirement was lower because, even though greenhouses require lighting, the lighting comes in the form of sunlight, which does not contribute to the purchased energy amount.
The wide range in the greenhouse numbers is due to the environmental factors that greatly affect climate control requirements. This wide range ultimately means that for each location, whenever growing produce directly in the field is not possible, there are certain times of year when it would make sense to use a plant factory and other periods when a greenhouse would consume less energy. Determining these exact periods proved to be a worthwhile effort, as it can be easily reproduced in different locations.
A Comparison Example
Suppose a lettuce (the most common produce used in the majority of studies) farmer in an urban center — Chicago, Illinois, is used for this exercise — has a large plot of land capable of fitting a lettuce field, a greenhouse and a plant factory next to a trendy restaurant. The field, greenhouse and plant factory can be sized to yield the exact same amount of lettuce. Before building this three-in-one farm, there are a few questions the farmer would like answered:
- When should each type of building be used to achieve the lowest annual energy consumption while maintaining a constant supply of lettuce throughout the year?
- If using shipping containers to build the plant factory, how many would be needed to supply produce for an average-sized restaurant?
- What would be the average power usage for each container in this Chicago-based plant factory?
The first question required four data sources:
- An earlier study that compared the energy consumption in greenhouses and plant factories in four cities — Atlanta, Georgia; Helena, Montana; Minneapolis, Minnesota; and Phoenix, Arizona. For Helena specifically, the study went one level deeper and made available not only yearly but also monthly energy consumption data.
- The planting calendar for lettuce in Chicago.
- The average temperature for every month in 2018 for Chicago and Helena.
- The average solar irradiance for every month in Chicago and Helena.
It also used four assumptions:
- Throughout the year, only one type of building is used at a time.
- Temperature is the only factor affecting heating and cooling energy consumption.
- Solar irradiance is the only factor affecting lighting energy consumption.
- For each building type, the monthly energy consumption values (cooling, heating and lights) are calculated based on a linear trend using the two closest values of the data available for Helena. For example, to calculate the heating energy consumption in the Chicago greenhouse in May, when the average temperature is 61° F, the Helena greenhouse heating energy consumption in September (58° F average) would be averaged with June (64° F average).
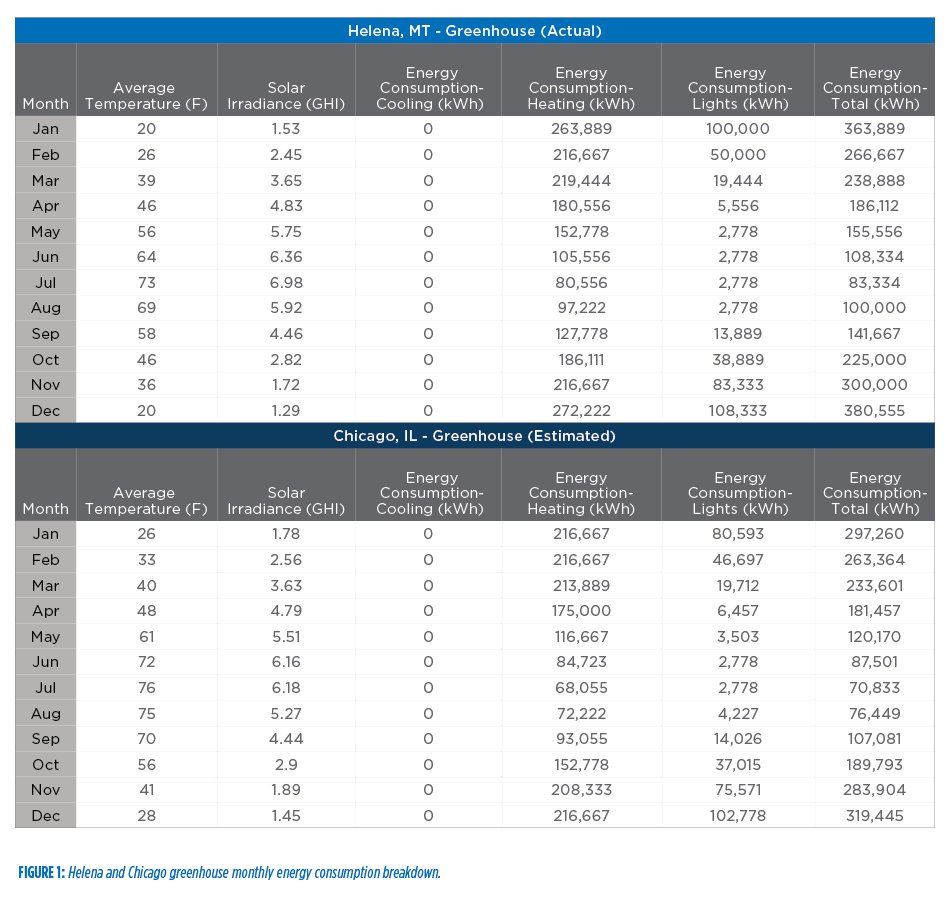
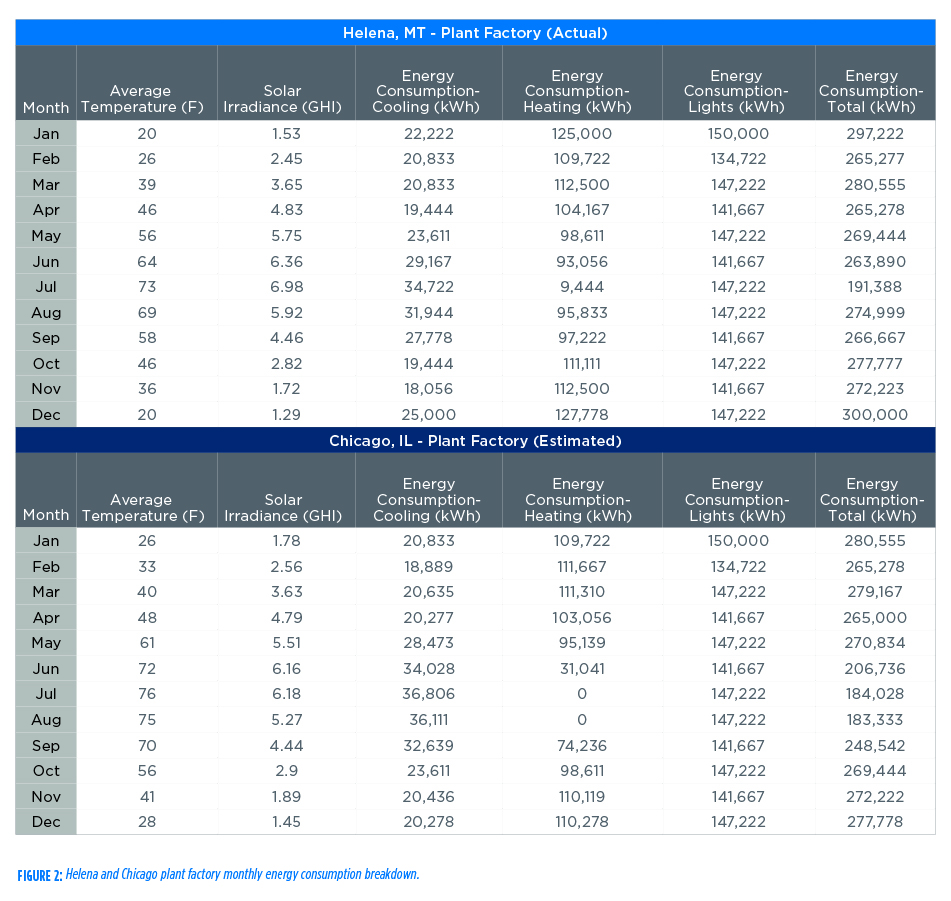
Using the planting calendar for lettuce in Chicago, it was determined that field-grown lettuce is only an option in May, June, September and October; since field growing consumes barely any energy, it was the option chosen for these months. For July and August, field growing and greenhouses are not a viable option because these are the hottest months of the year, and the field and greenhouse options do not have a cooling system; for this period, the plant factory was chosen because it has cooling capability. For the other months, a comparison between the energy consumption in the Chicago greenhouse and the Chicago plant factory was necessary. See Figure 1 for the actual (Helena) and estimated (Chicago) energy consumption values for the greenhouse and Figure 2 for the actual (Helena) and estimated (Chicago) energy consumption values for the plant factory.
Comparing the total energy consumption values, it is determined that lettuce in Chicago should be:
- Field-grown in May, June, September and October.
- Greenhouse-grown in February, March and April.
- Plant factory-grown in January, July, August, November and December.
The second question, about the number of 40-by-8-foot shipping containers required to supply the produce needs for an average-sized U.S. restaurant, uses the following statistics:
- 10% of all produce is consumed in U.S. restaurants.
- 312.22 g of vegetables are consumed per person per day in the U.S.
- There are 328.4 million people in the U.S.
- There are 660,755 restaurants in the U.S.
- 48 lettuce heads per square meter is the yield of a plant factory.
- An average lettuce head weighs 800 g.
- The lettuce planting cycle lasts 90 days.
- The standard container size is 40 feet (12.192 m) by 8 feet (2.438 m), which equals 320 ft2 (29.724 m2)
Note that lettuce is not the only vegetable used by a restaurant, but it provides an accurate estimate for a restaurant’s produce needs. Using these statistics, the total weight of produce consumed in U.S. restaurants per day is calculated to be 10,253,304.8 kg. Dividing this by the number of U.S. restaurants yields 15.5 kg consumed in an average U.S. restaurant per day. Multiplying this by 90 days (lettuce planting cycle) totals the 1,396.6 kg of produce consumed in an average U.S. restaurant per lettuce planting cycle. If a standard container can produce 48 lettuce heads x 800 g x 29.724 m2 = 1,141.4 kg, then, over the 90 days, if staggering the produce growth, the average U.S. restaurant would need 1.22 containers for its produce needs. In a scalable amount, a U.S. restaurant needs one produce container for every 12.7 kg of produce required daily.
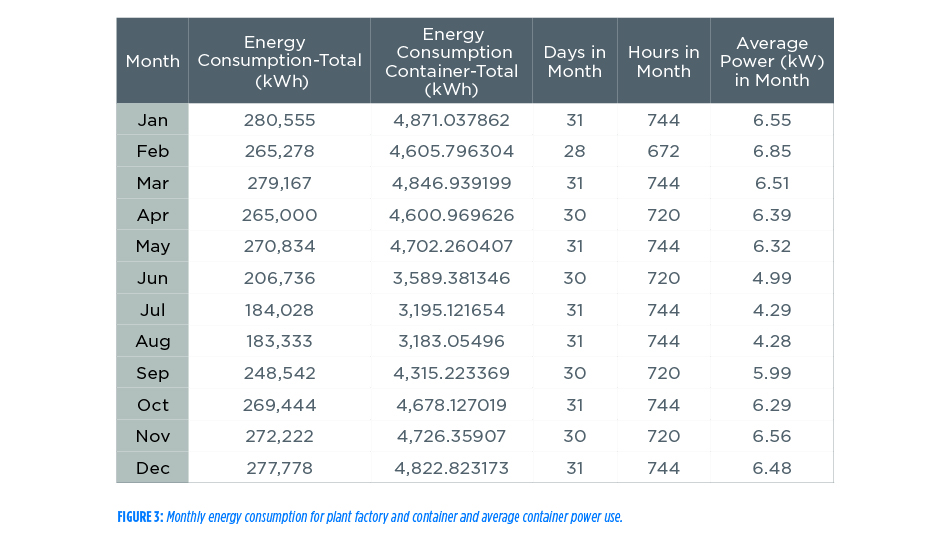
Finally, the average amount of power required in Chicago by each of these container plant factories is calculated. The monthly energy consumption for the Chicago plant factory in Figure 2 adds up to 3,002.9 MWh annual energy consumption. Since this calculation used a 1,712 m2 plant factory, scaling this number down to a standard container size results in 52.1 MWh annual energy consumption and 5.95 kW average power use. See Figure 3 for the monthly energy consumption of the plant factory, shipping container and average monthly power use of the shipping container.
Plant Factory Efficiency
The key to making plant factories more viable in terms of purchased energy is artificial lighting efficiency. The better the efficiency of the lighting system, the more that plant factories will be used, on a purely economic basis. The first study model uses LED lighting with 52% efficiency; the remaining 48% dissipates as heat, which is extracted by water cooling for optimal efficiency. Increasing this efficiency to 59% could reduce electricity use to 210 kWh/kg. Increasing the efficiency to 100% could reduce electricity use to 124 kWh/kg, depending on the location. Photovoltaic cells also could be used to generate part of the required plant factory energy, but because of their small area, energy production on the roof of the structure would only account for 2.71% of the plant factory’s total annual electricity requirement.
The farm-to-table and locavore (person whose diet consists only or principally of locally grown or produced food) movements will drive some uneconomic behavior because consumers will choose to pay extra for the locally grown produce. Fear of contamination also will help to drive uneconomic adoption of plant factories. Therefore, care must be taken with our assumptions. Even if lighting efficiencies aren’t dramatically improved, the number of plant factories might still increase substantially.
Location and Purpose Considerations
These findings lead to two important considerations regarding location and plant factory purpose. First, even though the benefits of solar energy in greenhouses exceed the need for climatization in all environments, greenhouses in most extreme weather locations are not viable without aggregating features of plant factories, such as artificial lighting and active heating or cooling.
As agriculture moves farther from an ideal climate for a plant species, the need to move first to a greenhouse and then to a plant factory becomes more urgent. This is a gradual shift from nearly natural to fully controlled interior production climate.
Second, plant factories do not always optimize for minimal energy or environmental footprint. Energy efficiency could be sacrificed in urban areas for a higher production per unit area, for example. A producer might also choose a less energy-efficient plant factory to avoid the risk of insufficient supply or contamination. Moreover, the closed production environment of a plant factory minimizes the risk of pathogen infiltration and the need for protective chemicals.
Much depends on the mission and purpose of the farm. Utilities in rapidly urbanizing territories and in regions with more moderate weather will need to be attentive to these trends and to the increase in artificial lighting efficiency. These farms have the potential to increase the load required for 1 kg of produce by 350%. Additionally, local income levels and attitudes can also shift production; one contamination event can trigger rapid menu changes in some restaurants and neighborhoods.
Energy Consumption Breakdown
In the same comparison study, the annual energy consumption for plant factories, plant factories with an economizer (used to save energy when outside conditions are suitable), greenhouses, and greenhouses with winter ventilation are compared in four U.S. cities: Atlanta, Helena, Minneapolis and Phoenix. Consumption is broken down by lighting, heating and ventilation/cooling. Every plant factory in the case studies required more total energy, more lighting and more ventilation/cooling than the greenhouses. Heating in Helena greenhouses and Minneapolis greenhouses with winter ventilation required more energy than their plant factory counterparts.
The more extreme differences in energy consumption happened in Phoenix and Helena. The Phoenix plant factory consumed 4,056 MWh per year, broken into 42.8% lighting, 37.9% heating and 19.3% ventilation/ cooling. The greenhouse in this location consumed 347 MWh per year, broken into 40.3% lighting (mostly provided by the sun), 53.4% heating and 6.3% ventilation/ cooling. The Helena plant factory with economizer consumed 3,303 MWh per year. This consumption consisted of 52.7% lighting, 38.7% heating and 8.6% ventilation/cooling. The greenhouse with winter ventilation in this location consumed 2,574 MWh per year. This consumption consisted of 17.4% lighting (mostly provided by the sun), 81.6% heating and 1.0% ventilation/ cooling. These results confirm that the predominance of plant factories lies in artificial lighting efficiency and that electric utilities need to be prepared for a 1.5- to 16-fold load increase (depending on location) for each new plant factory.
Cannabis Production
Indoor and outdoor cannabis production represents the other half of the current agricultural revolution. Due to weather conditions and indoor production costs in states where cannabis is legalized, about 90% of cannabis production in the U.S. is outdoors. In Tennessee, Kentucky, Hawaii and Washington, outdoor production is close to 100%. In Idaho and Oregon, the method of production is more balanced: 65% of cannabis in Idaho is produced outdoors; in Oregon, the percentage is 55%. Montana is at the other end of the spectrum, with only 20% outdoor production. Most states mandate a certain level of security on the growing operations, which can force growers inside regardless of the climate.
According to a 2014 study from the Northwest Power and Conservation Council, hundreds of producers in the state of Washington have been licensed to process cannabis. Growers of cannabis represent about 80-163 MW of new demand to the Northwest region’s system. Since the estimated share of cannabis production in this region amounts to 21% (18% in Washington and 1% each in Oregon, Idaho and Montana), the total demand in the U.S. can be estimated to vary between 381 MW and 776 MW. This amount deserves some special attention from electric utilities, especially as more states legalize cannabis and demand continues to grow.
Even though only 10% of cannabis in the U.S. is grown indoors, the load profile for cannabis plant factories is far from flat -- but growers who have limited access to capacity or have a demand charge tend to engineer the facility and lighting cycles to make it flat. Growers tend to segment the facility into “rooms,” dividing different stages of growth by room. This allows year-round harvest, and growth-cycle management. A typical plant close to harvest may consume 3 kW of energy for up to 16 hours a day. In a typical, 1,000-plant operation the operation may be a 5-MW to 8-MW load depending on the local regulation on odor and the local environment.
Indoor growth requires 5,000 kWh/kg of cannabis, and lighting alone accounts for up to 80% of electricity use. Again, it is important to note how artificial lighting efficiency plays a crucial role in the balance between indoor and outdoor farms. Switching to more efficient lighting has the potential to generate demand savings of 23 MW to 50 MW by 2021 in Washington. Many growers might consider switching to the more efficient LED lamps but are concerned about their cost and the quality of the product produced. Most growers continue to use the conventional lighting that was pioneered in the 1960s.
Finally, it is important to characterize the load types in the different plant factory rooms required for cannabis production. The vegetation room requires a 1,000-watt metal-halide lamp for every two to eight plants and needs the lamps to be on for at least 18 hours per day. The flowering room requires a 1,000-watt high-pressure sodium adjustable ballast lamp for every two to three plants and needs to be on for 12 hours and off for 12 hours. A separate HVAC with temperature and humidity set points is required for each room in addition to an air conditioning mini split for every 1,000 square feet.
Conclusion
The efforts to characterize these relatively new types of load need to continue nationwide to make estimates more accurate. From a utility’s perspective, these loads can vary not only in average load size, but also in load profiles. The main similarity in all plant factories is the relatively high load percentage required for artificial lighting. If lighting efficiency can be increased by at least 7% or 8%, a major shift from greenhouses to plant factories would be expected, and most U.S. consumers might soon be living directly above or below their source of produce.


.svg)