Case Study

Turnpike Authority Safety Assessment Advances Data-Informed Roadway Improvements

The Kansas Turnpike Authority leveraged a data-driven safety assessment to identify and prioritize systemwide improvements. Focusing on risks related to speed, wet pavement and curves, the study guided targeted countermeasures and long-term monitoring strategies, enhancing roadway safety and positioning the KTA for continuous improvement in crash prevention and risk mitigation.


Challenge

The Kansas Turnpike Authority (KTA) has long prioritized roadway safety, implementing features such as median barriers, wide shoulders, rumble strips, interchange lighting, mile markers every two-tenths of a mile, and high-visibility striping. It also enjoys the benefit of a dedicated Kansas Highway Patrol (KHP) troop focused solely on the turnpike, along with an incident management center.

With an already strong safety record, KTA faced a unique challenge — determining where further improvements could be made to mitigate the risk of future crashes. Without clear high-risk locations, a strategic, data-driven approach would be necessary to identify and prioritize safety investments effectively. With safety embedded in KTA’s mission, the organization was seeking to refine its efforts by identifying the most impactful safety improvements for the greatest overall benefit.

SAFETY ASSESSMENT COVERED

236

FREEWAY MILES

GATHERED SURVEY RESPONSES FROM

1K+

TURNPIKE USERS

EVALUATED

7

TARGETED SAFETY COUNTERMEASURES

Solution

To meet this challenge, KTA engaged Burns & McDonnell for a comprehensive, multiphase safety assessment aimed at analyzing crash patterns, evaluating potential countermeasures and developing a forward-looking safety strategy. The approach incorporated both quantitative crash data and qualitative insights from turnpike users, law enforcement officers and operational staff to create a well-rounded understanding of roadway safety risks and opportunities for improvement.

Burns & McDonnell worked with the KTA to structure the project in three phases, allowing the project team to review the findings at the end of each phase and use them to shape the direction of the next phase:

  1. Data collection and analysis.
  2. Countermeasure identification and evaluation.
  3. Implementation planning and performance measurement.


Read The Case Study

Solution

To meet this challenge, KTA engaged Burns & McDonnell for a comprehensive, multiphase safety assessment aimed at analyzing crash patterns, evaluating potential countermeasures and developing a forward-looking safety strategy. The approach incorporated both quantitative crash data and qualitative insights from turnpike users, law enforcement officers and operational staff to create a well-rounded understanding of roadway safety risks and opportunities for improvement.

Burns & McDonnell worked with the KTA to structure the project in three phases, allowing the project team to review the findings at the end of each phase and use them to shape the direction of the next phase:

  1. Data collection and analysis.
  2. Countermeasure identification and evaluation.
  3. Implementation planning and performance measurement.

Data Collection and Evaluation
This phase focused on analyzing crash data and gathering input from turnpike users and key stakeholders. The project team reviewed more than 5,000 crash records, assigning crashes to specific roadway locations (e.g., travel lanes, roadside, interchange areas and toll plazas), assessing trends over time, identifying locations with elevated crash rates and determining the most common crash types and causes.

Engagement activities included a survey of more than 1,000 turnpike users and interviews with key stakeholders such as the KHP, KTA operations staff, trucking companies, school bus coordinators, motorcycle advocates and others. These outreach efforts focused on understanding safety concerns and identifying risk factors affecting turnpike travel.

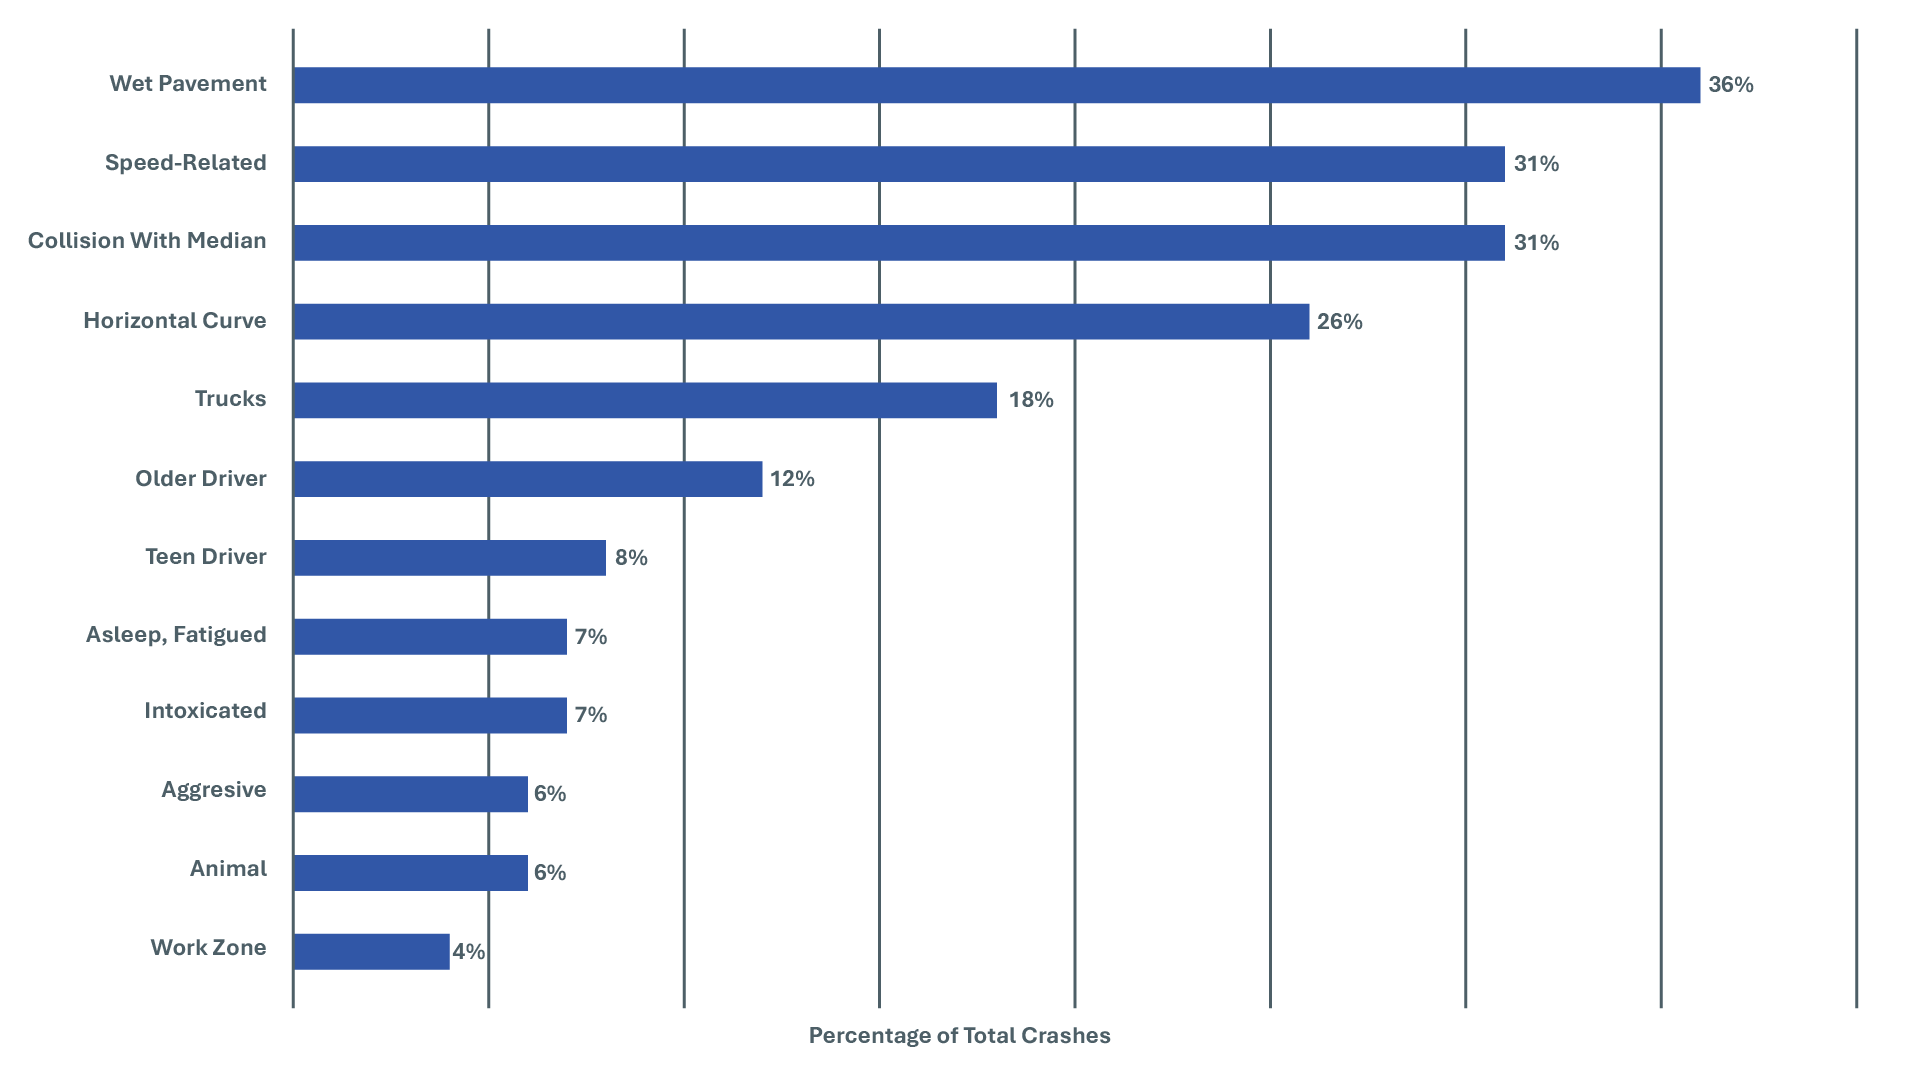
Findings revealed that crashes were dispersed throughout the turnpike rather than concentrated in specific high-risk locations. The seven locations with the most fatal and injury crashes spanned a total of 50 miles, accounting for only 32% of those crashes, while the remaining 68% occurred across the other 170 miles. The most frequent crash types involved wet pavement, horizontal curves and excessive speed. Many crashes were attributed to a combination of these factors.

Survey responses and stakeholder feedback confirmed that hydroplaning and speeding were top safety concerns. This assessment reinforced the value of a data-driven approach to roadway safety. Instead of focusing solely on high-crash locations, KTA’s strategy emphasized corridor-wide improvements, resulting in more effective safety interventions.

Identifying and Prioritizing Safety Countermeasures
Building on Phase 1 findings, the project team conducted additional data collection, including pavement friction testing along the entire corridor in both directions and 72-hour speed measurements at locations with a high prevalence of speed-related crashes, as well as control locations where speeding was not frequently cited in crash reports. Although overall pavement friction ratings were good, certain areas with lower traction corresponded with higher wet-pavement and roadway departure crashes. The speed study confirmed that most drivers exceeded the 75 mph limit.

Using predictive crash modeling and cost-benefit analyses, the team evaluated potential countermeasures and prioritized them for implementation.

High-friction surface treatments were recommended to improve traction on wet pavement and reduce hydroplaning incidents. Additional curve warning and advisory speed signs were suggested to improve driver awareness and reduce speed-related crashes on curves. Speed feedback signs were proposed to provide real-time alerts to drivers, helping them adhere to posted speed limits. Additionally, targeted enforcement zones were identified in high-risk areas to discourage aggressive driving behaviors and improve safety through increased law enforcement presence.

Figure 1: The percentage of fatal and injury crashes associated with specific risk factors. Multiple risk factors can contribute to a single crash, highlighting the complexity of crash causation and the need for comprehensive safety strategies.

CLICK TO ENLARGE

The Phase 2 final report included a matrix of potential safety countermeasures, prioritizing locations along the Kansas Turnpike for implementation based on crash trends and cost-effectiveness.

Implementation Tools and Long-Term Safety Evaluation
In Phase 3, the project focused on assessing tools and processes to monitor, evaluate and support safety performance into the future. In one task, the project team reviewed several third-party data vendors that collect traffic and safety data, provide analysis tools, and sell subscriptions or licenses to data and analysis platforms for roadway owners and operators. The evaluation found that the traffic data landscape is rapidly evolving but primarily focused on providing data the turnpike already has access to — such as traffic volumes, speeds and origin-destination data — or on predictive analysis in an urban context, which is not well suited to the turnpike’s largely rural freeway environment.

The study also reviewed the Kansas Department of Transportation’s ongoing safety corridor pilot program and explored the potential benefits of implementing a safety corridor on the turnpike to improve driving behavior in high-risk areas. The goal of the safety corridor would be to encourage drivers to pay attention, use caution and slow down through the use of warning signs and increased targeted enforcement. The team also recommended opportunities to implement review committees for fatal crashes and develop transportation management plans for turnpike work zones.

Phase 3 also focused on helping the KTA maintain effective safety measures over time by tracking key performance indicators, particularly for crashes related to wet pavement, curves and speed. The study team recommended ongoing monitoring of leading safety indicators, such as speed, by leveraging existing toll gantry infrastructure to collect anonymized speed and traffic volume data. By integrating performance tracking into its safety strategy, the Kansas Turnpike Authority could position itself for continuous improvement, allowing for future adjustments based on evolving trends and roadway conditions.

Results

This assessment reinforced the value of a data-driven approach to roadway safety. Instead of focusing solely on high-crash locations, KTA’s strategy emphasized corridor wide improvements, providing more proactive safety interventions. Crash data analysis and feedback from vested parties aligned closely, supporting the need for wet pavement countermeasures, improved curve signage and speed management solutions.

The study also highlighted the effectiveness of predictive modeling and cost-benefit analysis in prioritizing safety investments. By evaluating potential crash reductions alongside implementation costs, KTA was able to allocate resources for maximum impact. Additionally, the assessment positioned KTA to incorporate emerging safety technologies, such as real-time data monitoring and safety corridor initiatives.

Beyond immediate infrastructure improvements, the study established a long-term framework for continuous safety monitoring and investment. The results highlight the importance of data-driven decision-making in roadway safety. As KTA continues tracking safety performance and refining strategies, its efforts serve as a benchmark for data-driven roadway safety programs.


Project Stats


CLIENT

Kansas Turnpike Authority

LOCATION

Kansas