Traditional RF coverage planning methods often fall short because they fail to anticipate the potential for obstructions that may occur from buildings or infrastructure that are yet to be built. If we are to maintain the reliable communication infrastructure needed for land-mobile radio (LMR), public safety (PS) and distributed antenna systems (DAS), taking steps to account for any potential obstructions is a prudent and proactive step.
Modern tools like Pathloss 6 offer solutions that can address this gap. Advanced capabilities embedded in these technologies allow RF engineers to model the potential obstructions that could result from future construction. By integrating the available plans directly into models using GeoJSON or shapefiles, the precision and adaptability of network designs are both technically sound and construction ready.
Defining the Challenge
In high-stakes environments such as data centers or mission-critical campuses, signal disruption caused by new construction can compromise both safety and service continuity. Factoring in future buildings during early-stage RF coverage analysis is essential. Adding these buildings as custom obstructions helps planners determine the optimal tower location and number of towers required before construction begins. This can help minimize rework, avoid permitting delays and support early design coordination.
Designing RF coverage for sites that have not yet been built introduces additional complexity. By importing future building layouts into Pathloss 6 and applying custom obstruction modeling, we can identify where signals are likely to be blocked by upcoming structures. This insight enables more accurate determination of the number and placement of towers needed to provide adequate coverage. When considered early in the planning process, this information allows engineers to make informed decisions that reduce the risk of costly redesigns, streamline construction workflows and improve overall network performance.
Modeling Future Obstructions
To anticipate how future construction might affect signal coverage, we worked closely with the civil team to visualize the layout of upcoming buildings. Using CAD drawings, we re-created the planned structures in 3D, adding key details like building height and placement using tools such as Google Earth. The resulting models were used as custom obstructions in our RF coverage analysis. This allowed us to simulate how future development could impact signal performance across the site (see Figure 1).
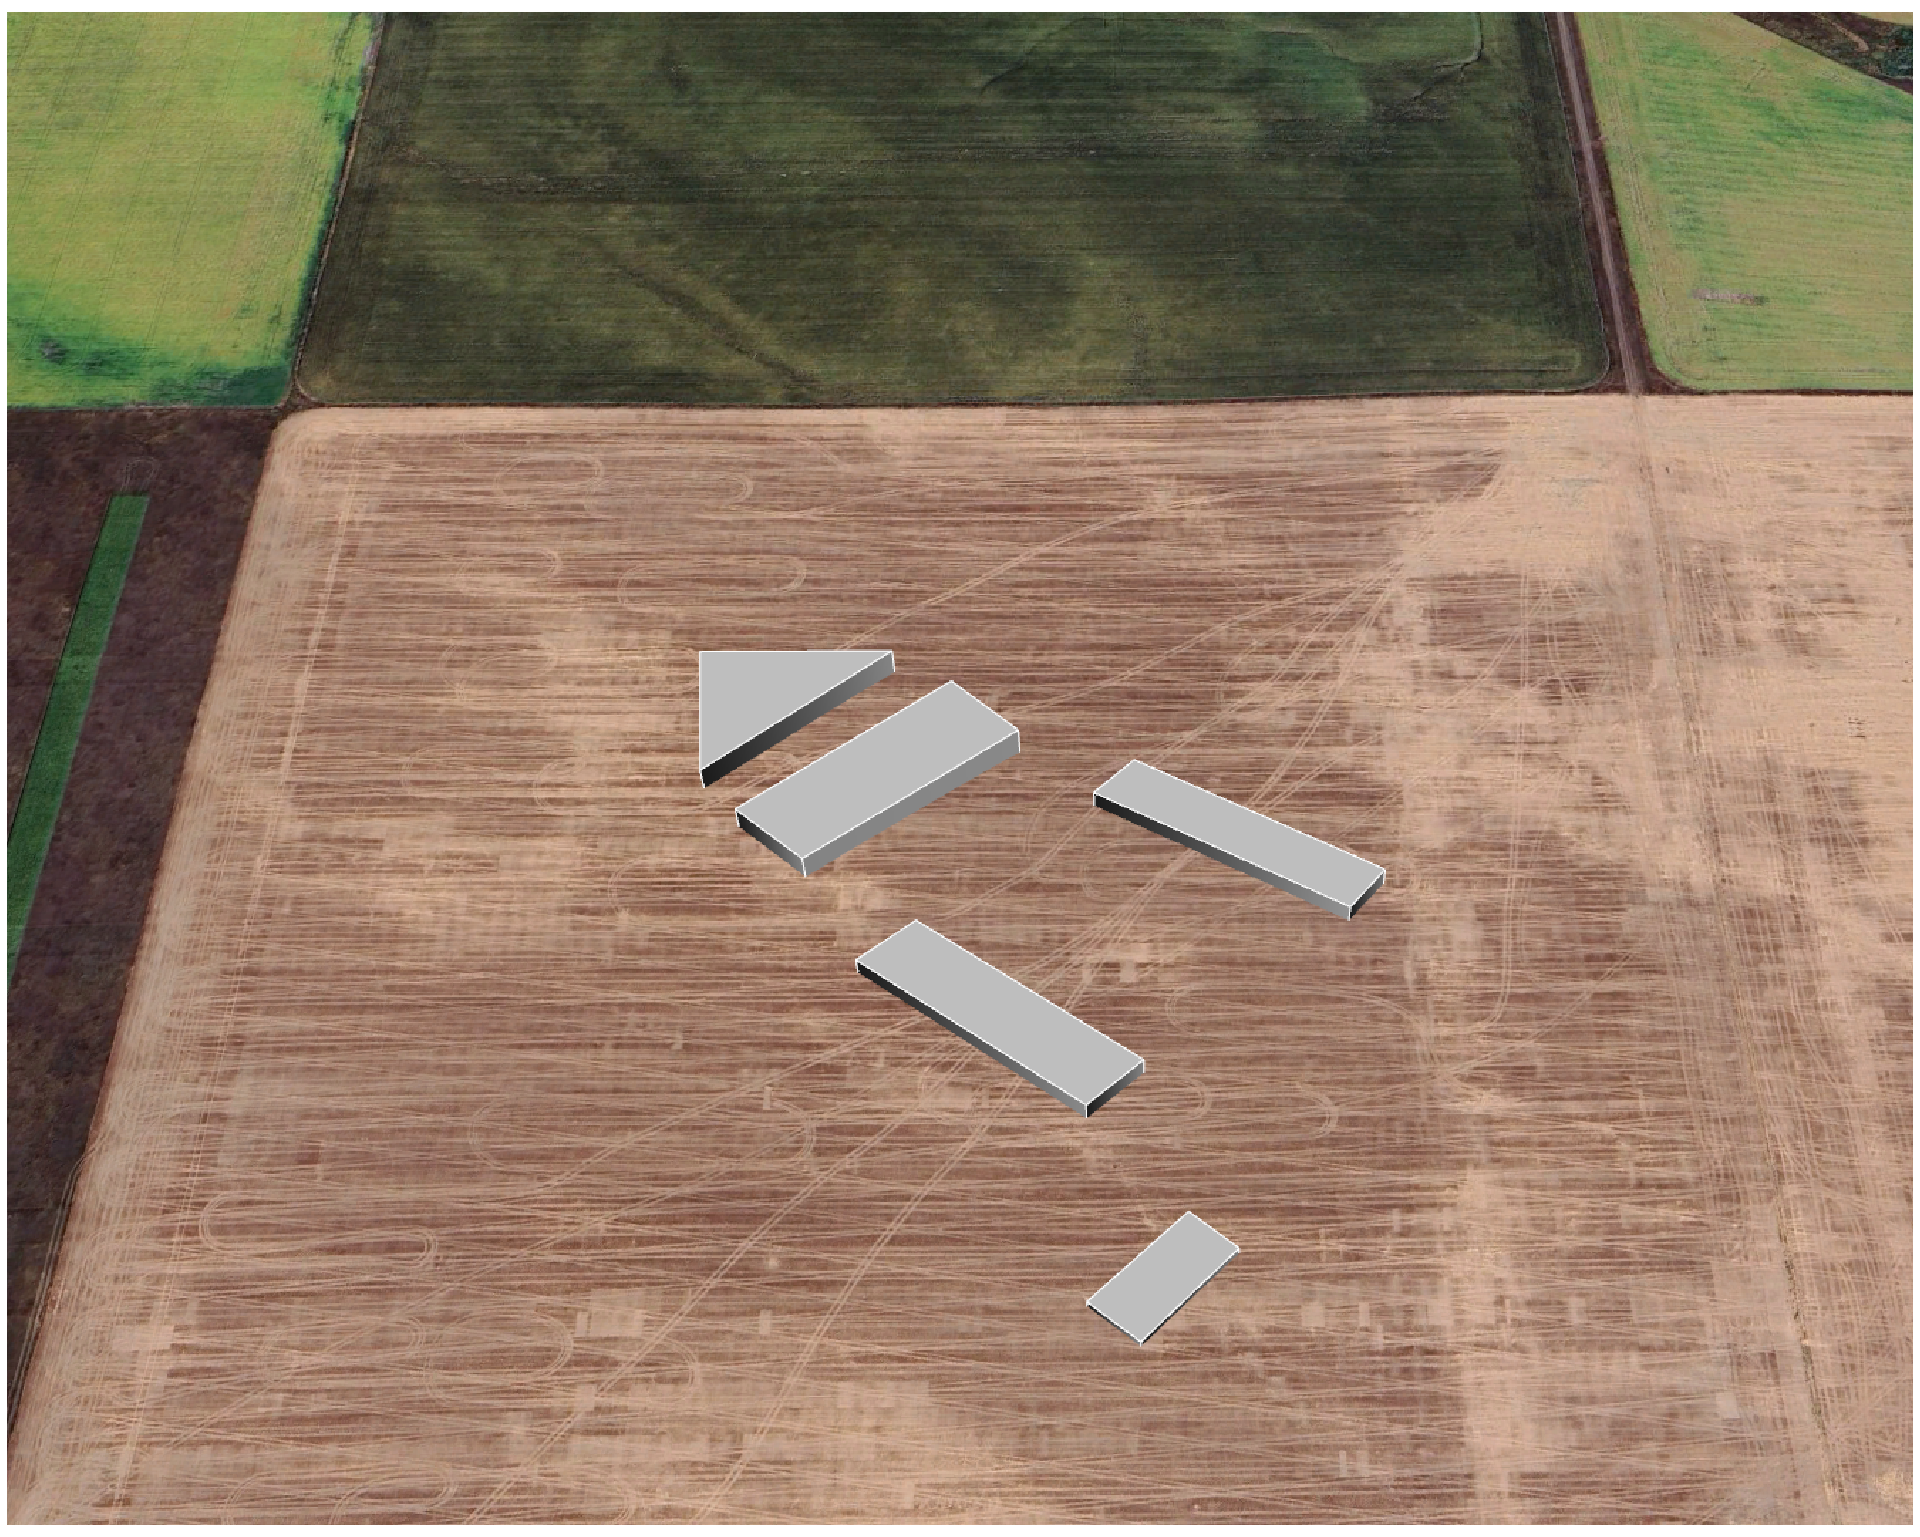
Figure 1: Building models were created in 3D format using Google Earth.
Because Pathloss 6 does not support direct import of .KML files from Google Earth, we converted the building models into GeoJSON, an open standard tool used to represent geographic features like points, lines, and polygons, along with their attributes. GeoJSON works especially well for bringing structures like buildings into RF coverage tools. This conversion enabled us to import the planned obstructions into Pathloss 6 and incorporate them into our analysis. The interface used to assign building attributes can be seen in Figure 2.
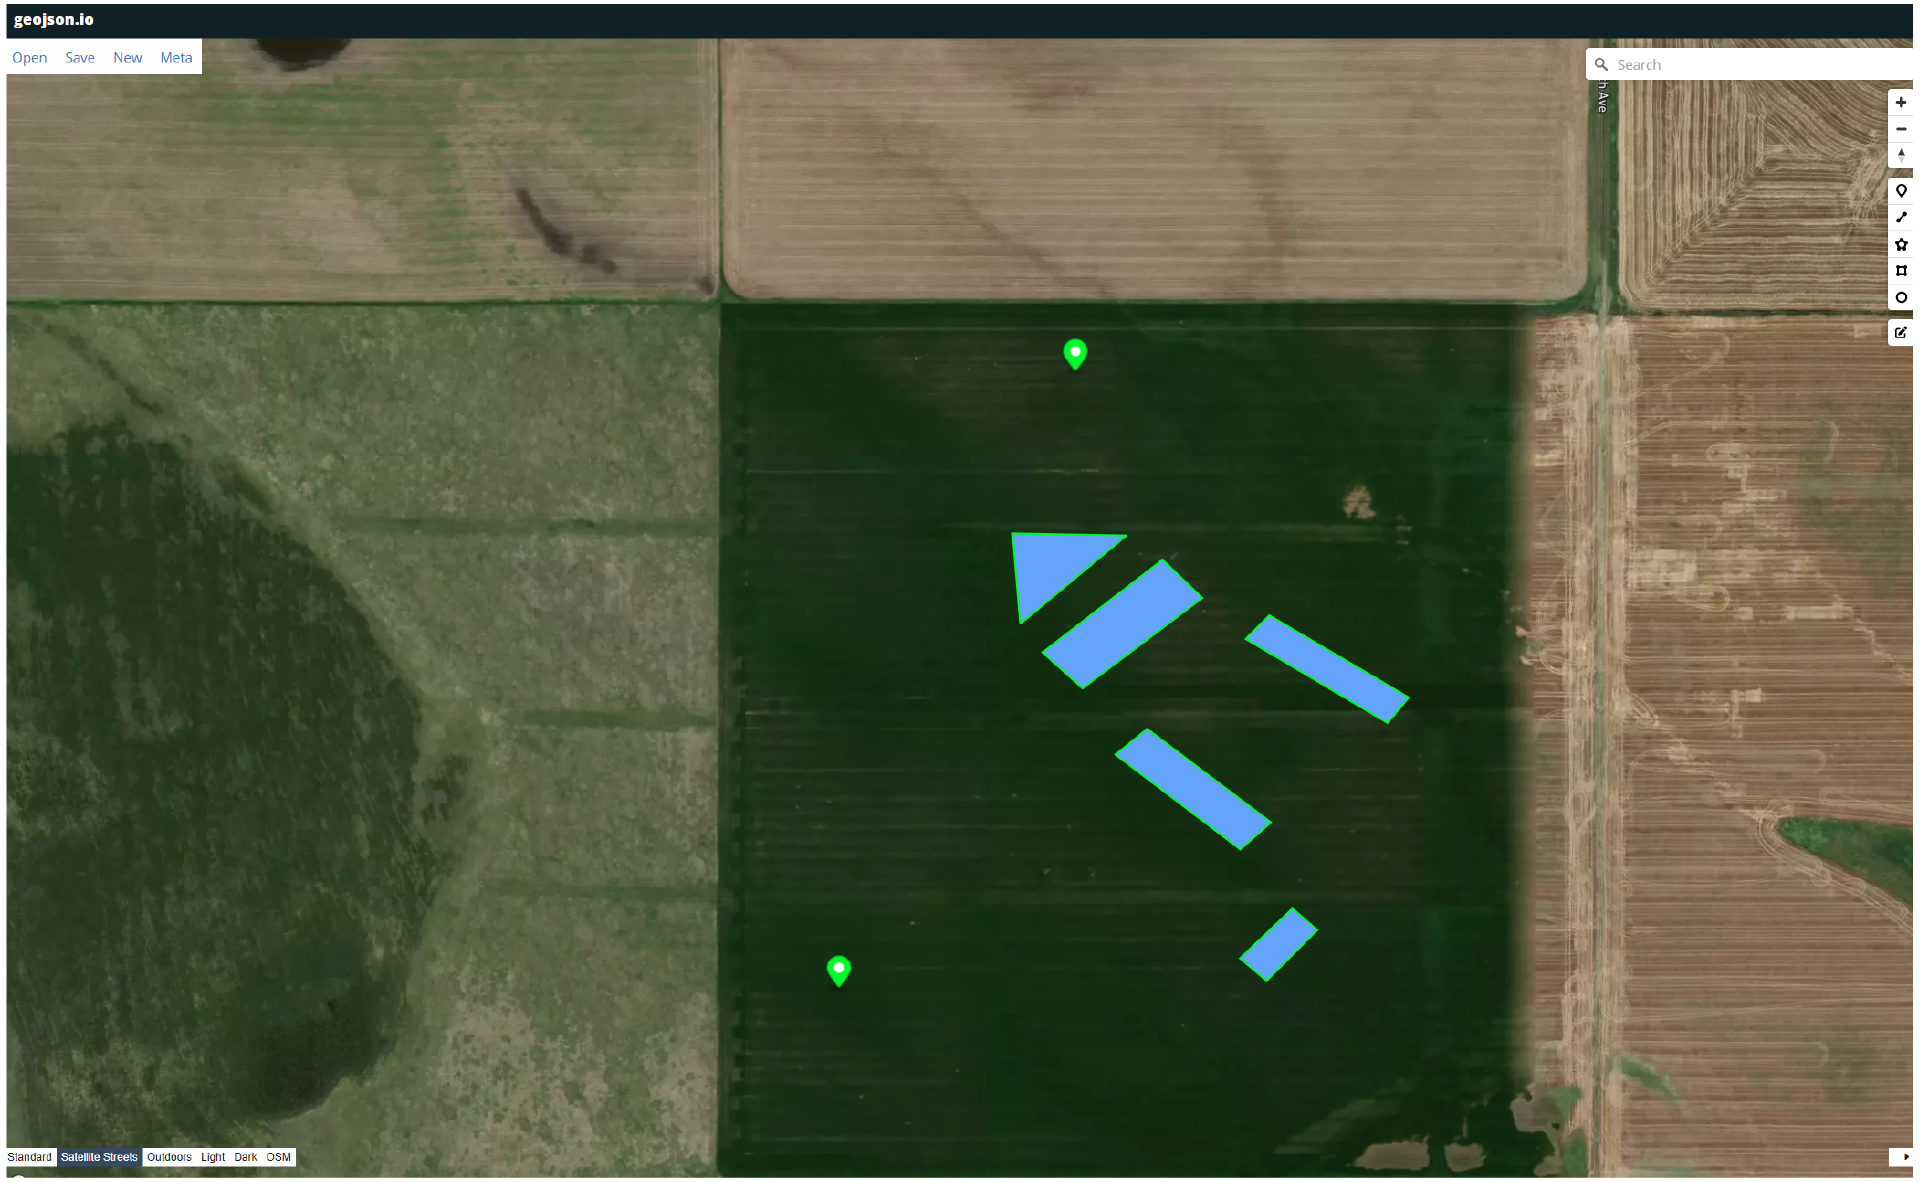
Figure 2: Building polygons are imported to GeoJSON to incorporate building dimensions for RF analysis in Pathloss.
Although it was not tested in this study, the latest version of Pathloss 6 also includes support for importing shapefiles (.shp) as custom obstructions, offering additional flexibility to model complex environments.
In this study, antennas were modeled at a height of 80 feet on 100-foot tower structures, using sector antennas to simulate directional coverage patterns. The tallest modeled building reached 52 feet, making accurate building dimensions essential for identifying potential line-of-sight obstructions.
After successfully importing the building data, site coordinates were used to generate corresponding coverage maps. To demonstrate this process, arbitrary building and tower locations were used, and no client-specific information was included. Two tower sites were selected, and individual coverage maps were generated for each site.
Coverage maps were generated to illustrate how future buildings may impact signal propagation from different locations (see figures 3 and 4). The maps use a color gradient to represent signal strength: Blue and green indicate strong signal coverage; yellow and orange reflect acceptable levels; and red to dark red highlight areas of poor signal coverage. This visualization offers a clear distinction between optimal coverage zones and areas requiring further attention.
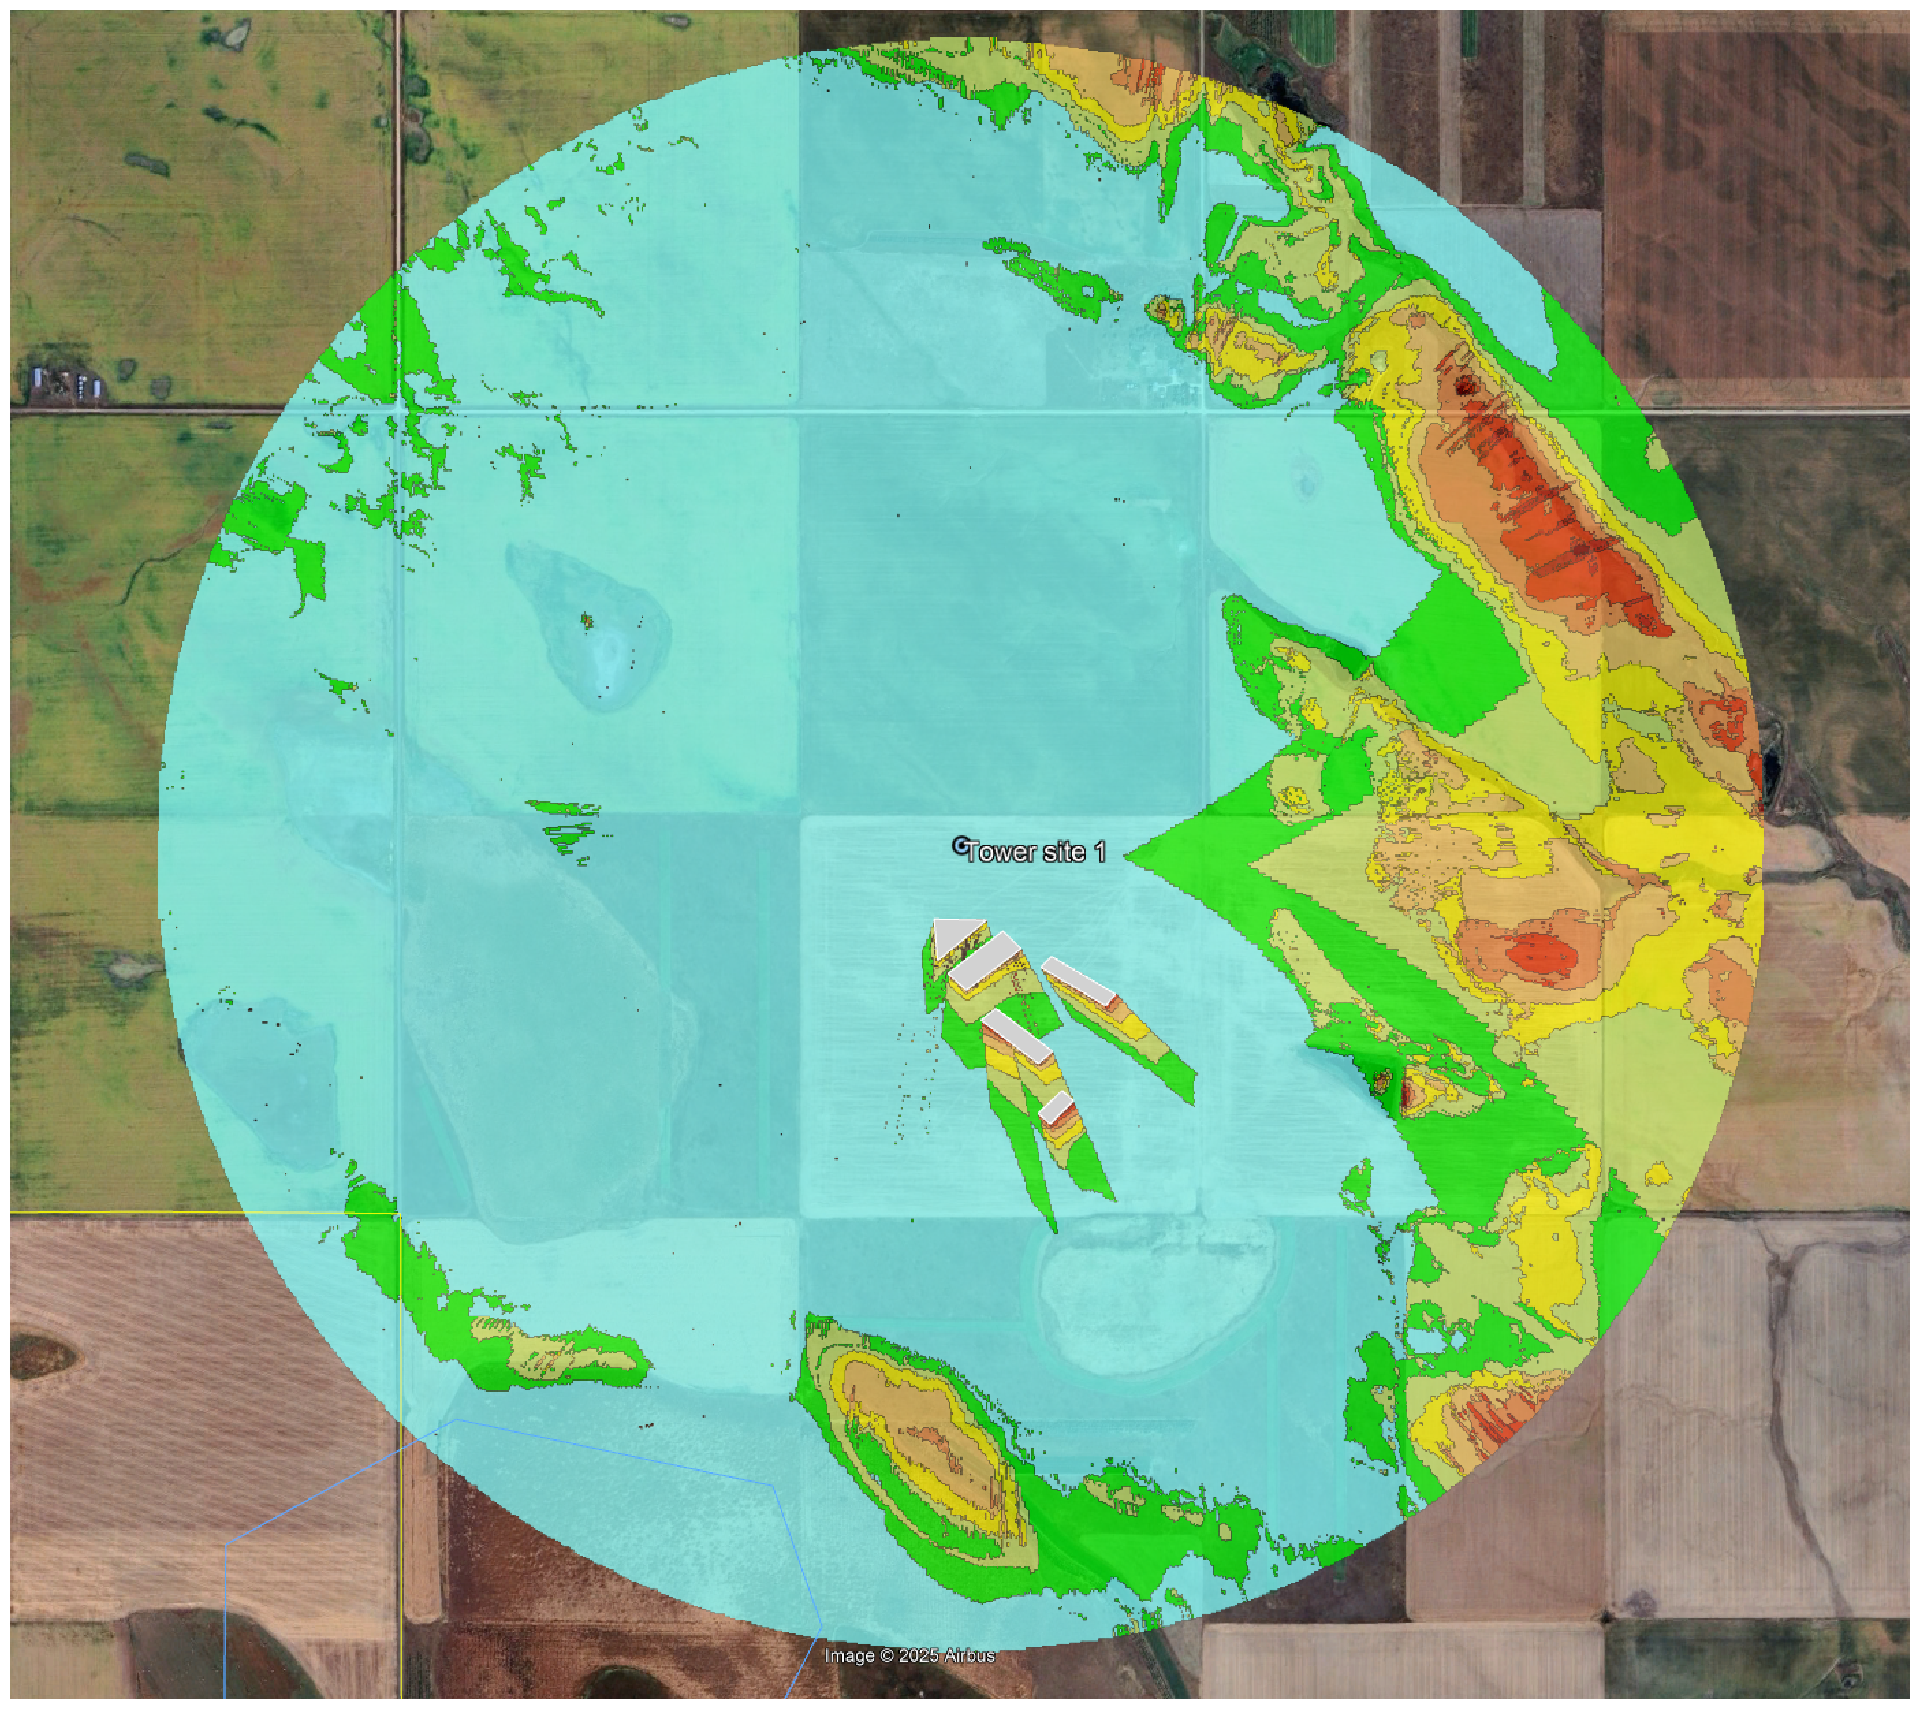
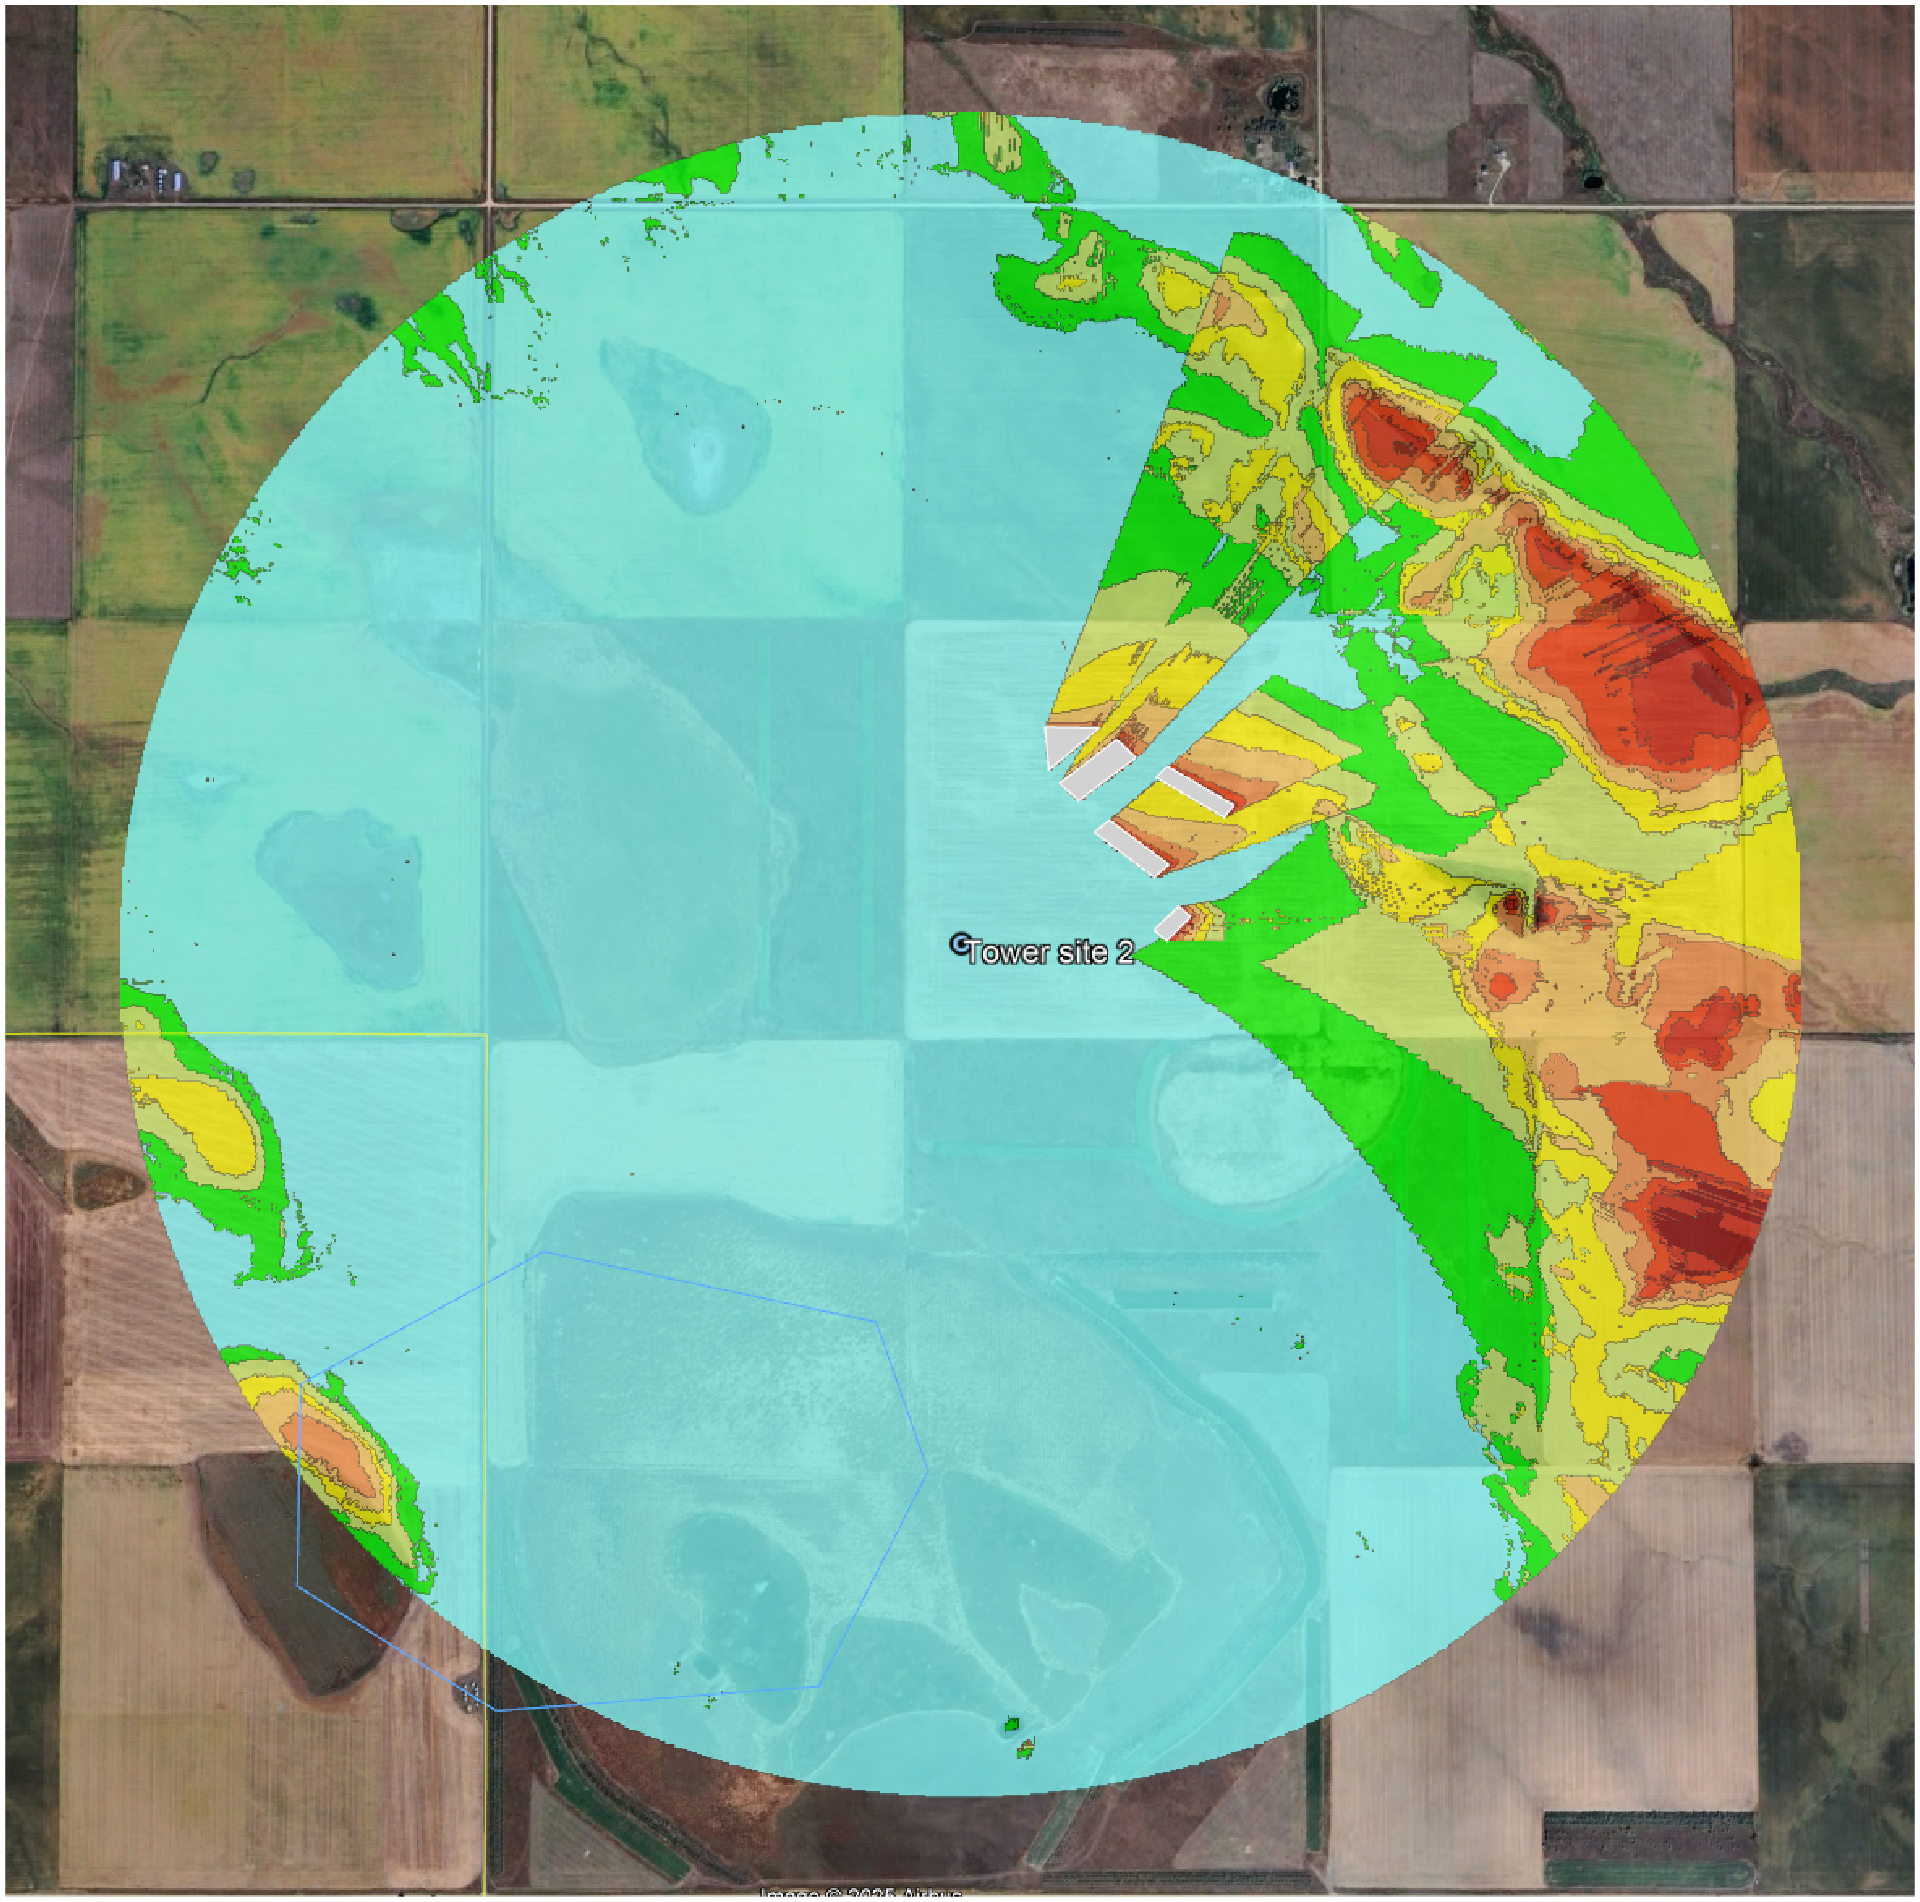
Figures 3 and 4: The coverage maps from tower sites 1 and 2 illustrate how signal propagation may be impacted by future buildings. The antenna heights and radio power were assumed, meaning that actuals could alter results. Signal strength is visualized using a color gradient, with blue and green indicating excellent coverage, yellow and orange representing acceptable levels, and red to dark red indicating poor or unacceptable signal strength.
With the obstructions modeled and verified, we were able to simulate RF conditions for the site as it is expected to exist post-construction, allowing for more informed tower placement decisions well in advance of any physical build-out. This workflow offers a practical way to anticipate and plan around future build environments, helping network designers align RF studies with evolving site conditions from day one.
Outcomes and Future Applications
By incorporating custom building models into Pathloss 6, we were able to conduct RF coverage analyses that account for future site conditions. This approach allowed us to:
- Introduce planned buildings or infrastructure as custom obstructions in the analysis to evaluate future RF coverage conditions.
- Design RF coverage maps that anticipate signal behavior around planned structures.
- Narrow down tower placement options before construction, increasing planning accuracy.
- Minimize the need for redesigns later in the project life cycle.
- Facilitate earlier decision-making across engineering, permitting, and civil teams.
- Build client confidence through RF studies aligned with the physical realities of future site development.
As more developments occur on vacant or evolving sites, the ability to simulate future conditions becomes increasingly valuable. Pathloss 6, combined with custom obstruction modeling using GeoJSON or shapefiles, empowers RF engineers to deliver more precise, adaptable and construction-ready network designs.
